Which products draw hands
Pickups per product and colour, by shelf zone and hour.
Not every store wants a screen on the shelf. GoTrack's product analytics works with cameras alone: which products are picked up, held, compared and put back, per product, colour and store.
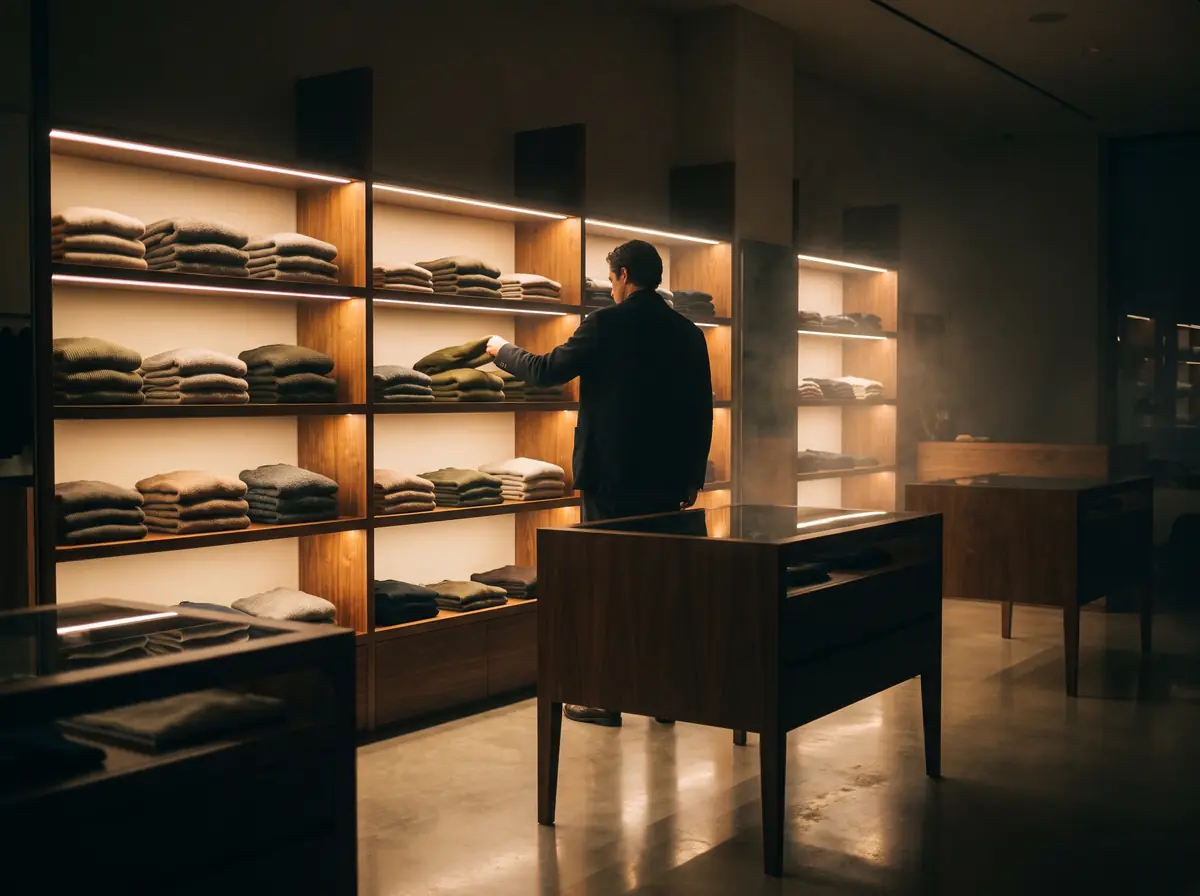
Camera-based shelf analytics measures what shoppers do with the products on a shelf, using cameras instead of tags, sensors or scanners. GoTrack reports pickups, hold time, put-backs, never-touched products and products compared together, by hour and shelf zone.
Pickups per product and colour, by shelf zone and hour.
The put-back rate per product: the ones that are considered, then left.
Products that sit on the shelf without interaction: candidates for a new place on the shelf.
No. GoTrack's product analytics works with cameras alone. Screens are optional: add them when you want the shelf to react to the product in hand.
Pickups, hold time, put-backs, never-touched products and products compared together, per product, colour, zone, hour and store; store visits; and, with screens, which content goes with longer holds. Every report can be filtered by store and exported as CSV or PDF.
Yes. Reports are per product and colour. When two variants are so alike that a camera cannot separate them, GoTrack shows them as a pair instead of guessing between them.
In the store. Images are analysed on a device in the store and are not sent to the cloud for analysis. Only product events and device health reach the cloud, which is also why recognition and screens keep working without internet.
Tell us about your stores and we will show you the reports on products like yours.
or write to info@gotonom.com