From the first day
Engagement with the new product before sales data comes in.
Sales figures arrive late and say nothing about the shoppers who looked and left. GoTrack shows, from the first day, how often a new product is picked up, how long it is held and how often it goes back, and how interest changes during a campaign.
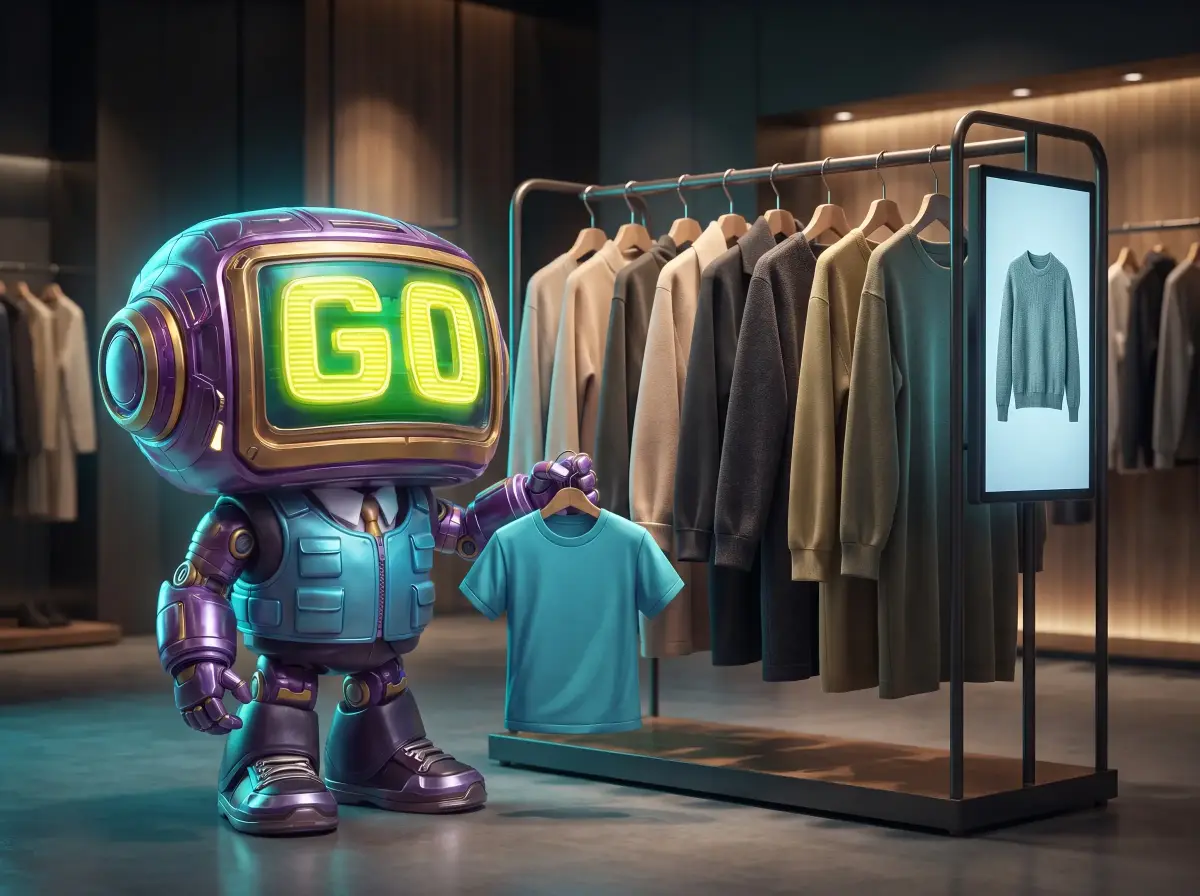
By how shoppers engage with the new product, from day one. GoTrack reports pickups, hold time and put-backs for the new product next to the rest of the range, per store and per day, and shows how interaction changes during a campaign window.
Engagement with the new product before sales data comes in.
The new product next to the products it competes with, including the ones it is compared with.
With screens, which campaign content goes with longer holds.
Yes. It reports pickups per product and variant, average hold time, put-back rate, products compared together and never-touched products. It measures how long a product is held, not how long someone stands in front of it.
Yes. Several stores and brands are managed from one panel, reports are split per store, and every store device's health is monitored remotely.
When a shopper holds a product, the screen linked to that area shows that product's content, and keeps showing it while the product is held. When no one is holding anything, the screen plays its playlist. The screens do not need to be touchscreens.
Not on its own. GoTrack measures what happens at the shelf — pickups, hold time and put-backs — and does not read POS data. To relate interest to sales, join GoTrack's CSV exports or webhook events with your own sales data.
Tell us about it and we will show you what GoTrack would measure.
or write to info@gotonom.com