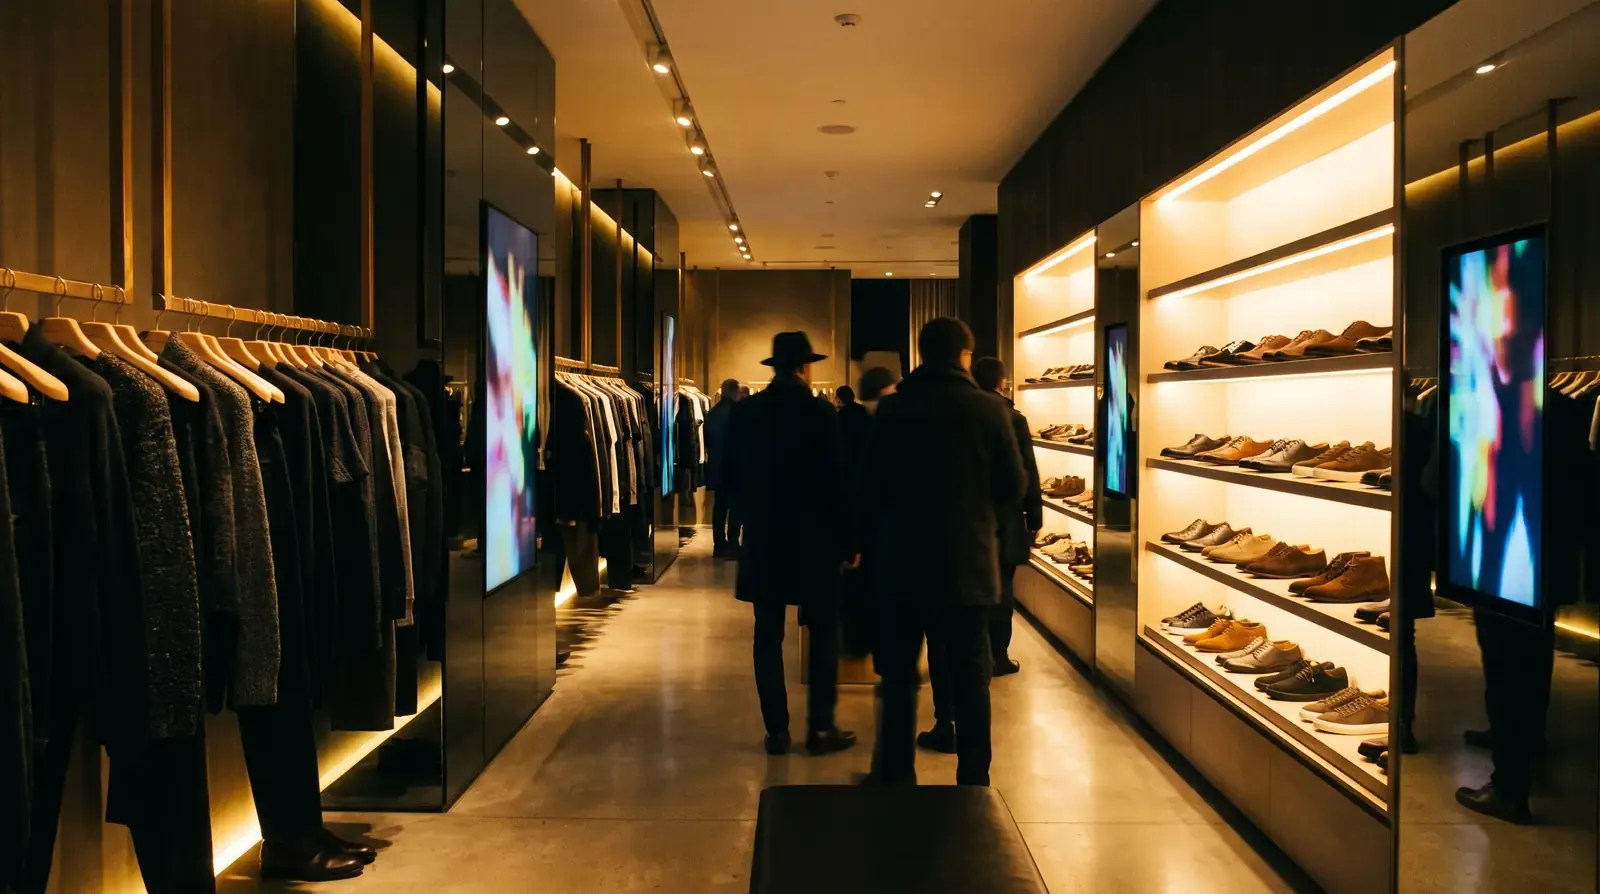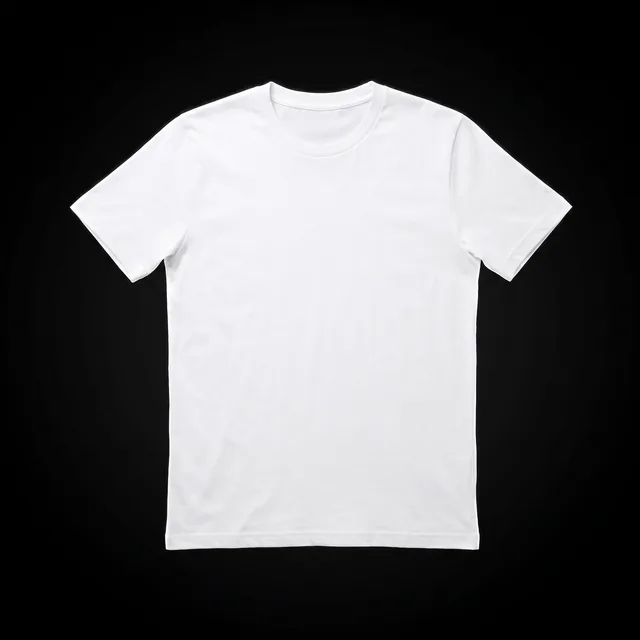
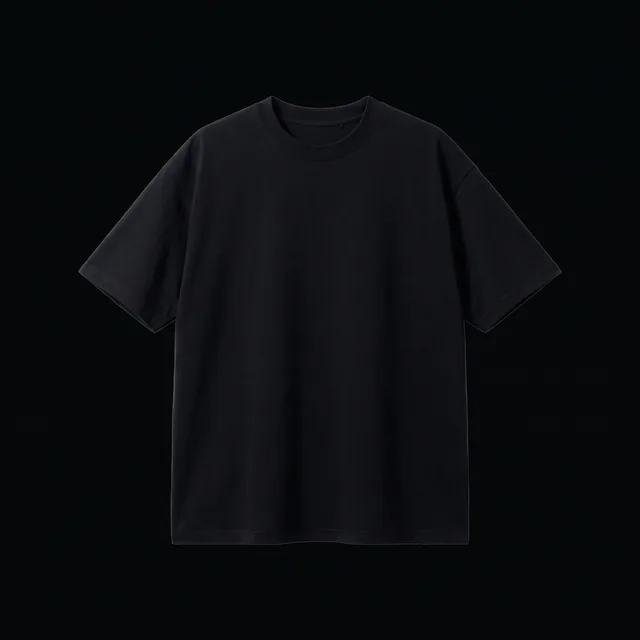
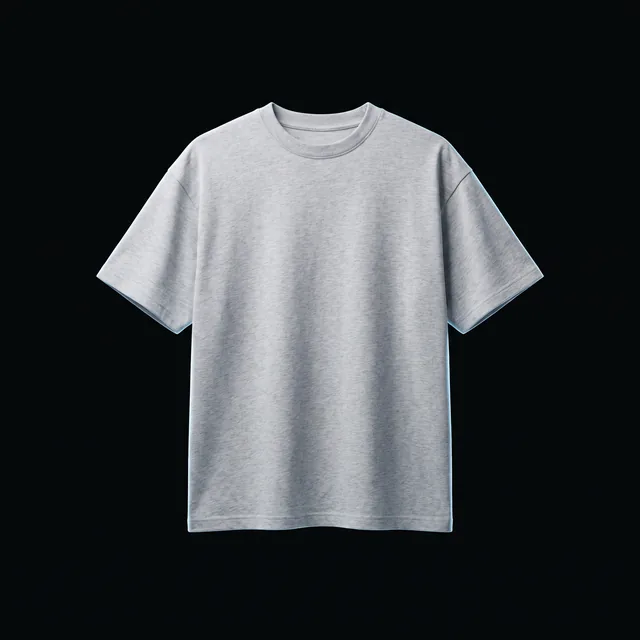
White essential tee
TS-WHT-001482pickups+18%
31 savg. hold+6 s
22%put-back rate
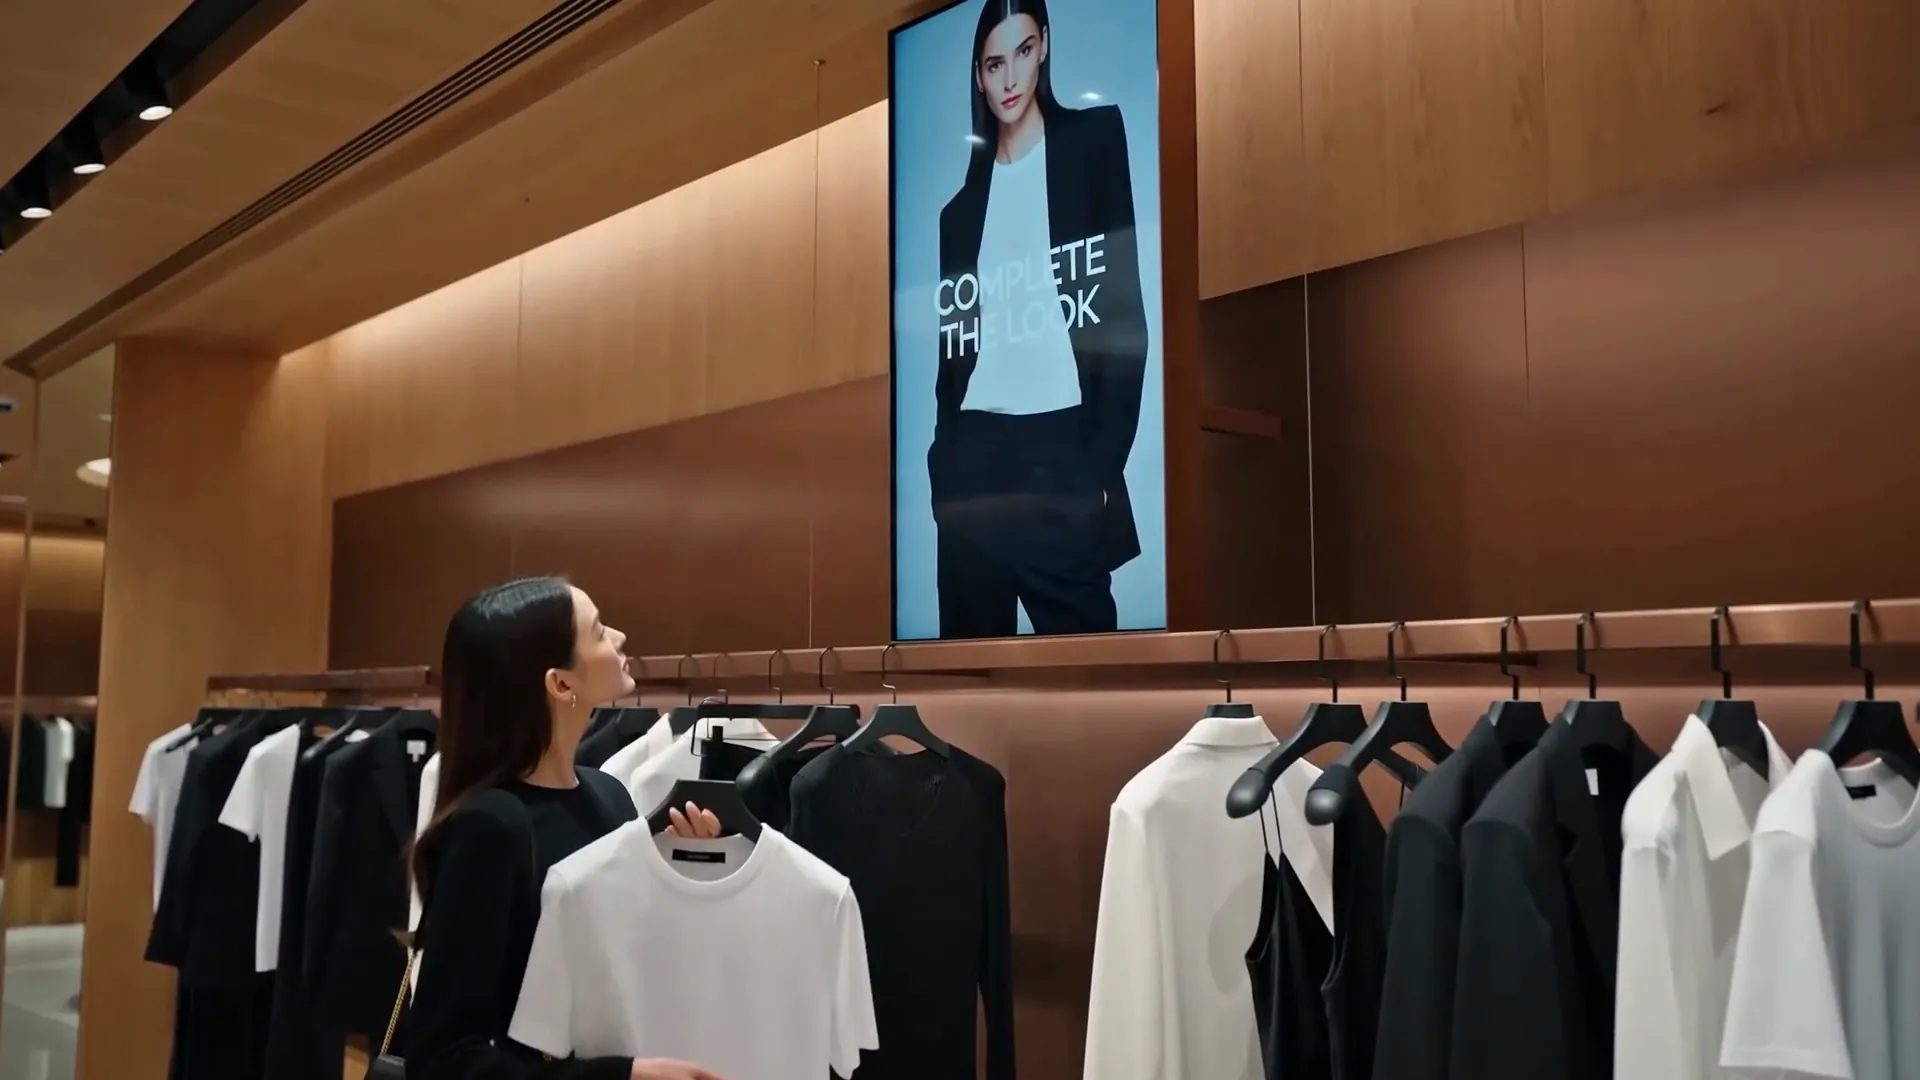
Physical retail intelligence
See how shoppers interact with every product. Understand what happens before the sale. Act in real time.
The sale is only the final event. GoTrack reveals the journey before checkout, product by product.
One number, at the till.
Ecommerce has measured product behaviour for decades. GoTrack brings that visibility into the physical store.


* Purchase is available when combined with sales data.
Example dataCameras placed near the products recognise which product and colour is in a shopper's hand, and record what happens to it. Your existing store becomes a product-interaction layer.

See what gets picked up, held, compared and put back, by product, colour, store and hour. Product-level behaviour, not people counting.
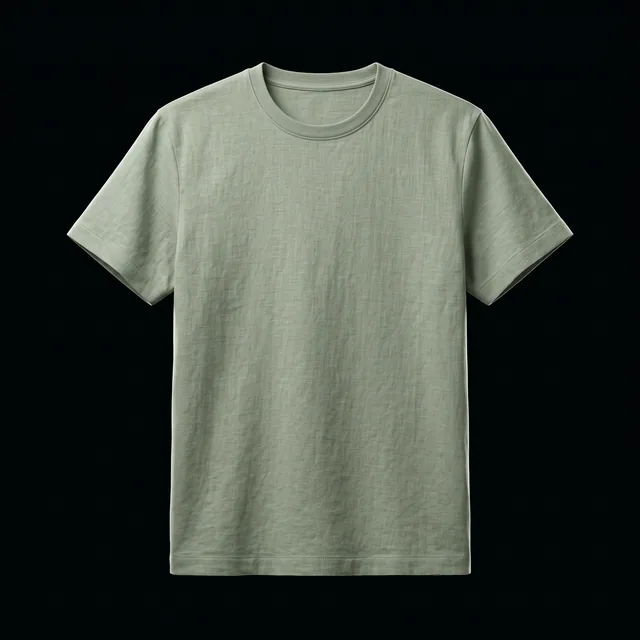
The green linen shirt is picked up 623 times and considered for 41 seconds on average; your sales data shows only 18 purchases. GoTrack adds the missing behavioural layer to the sales data you already own.
Explore insights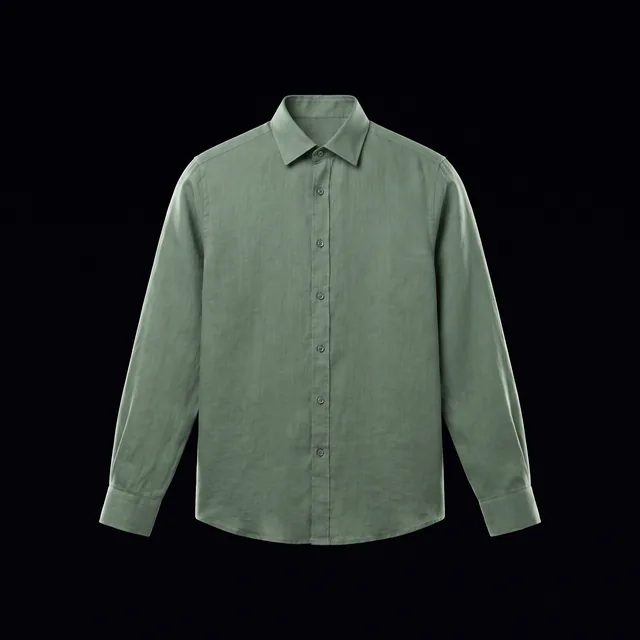
Compare the same product across stores, zones and shelves. GoTrack scales from one interaction to your whole network.
| Store | Interactions | Avg. hold | Put-back rate |
|---|---|---|---|
| Flagship storeİstanbul | 687 | 42 s | 18% |
| Mall storeAnkara | 411 | 29 s | 31% |
| City storeİzmir | 892 | 47 s | 12% |
GoTrack can stop at analytics.
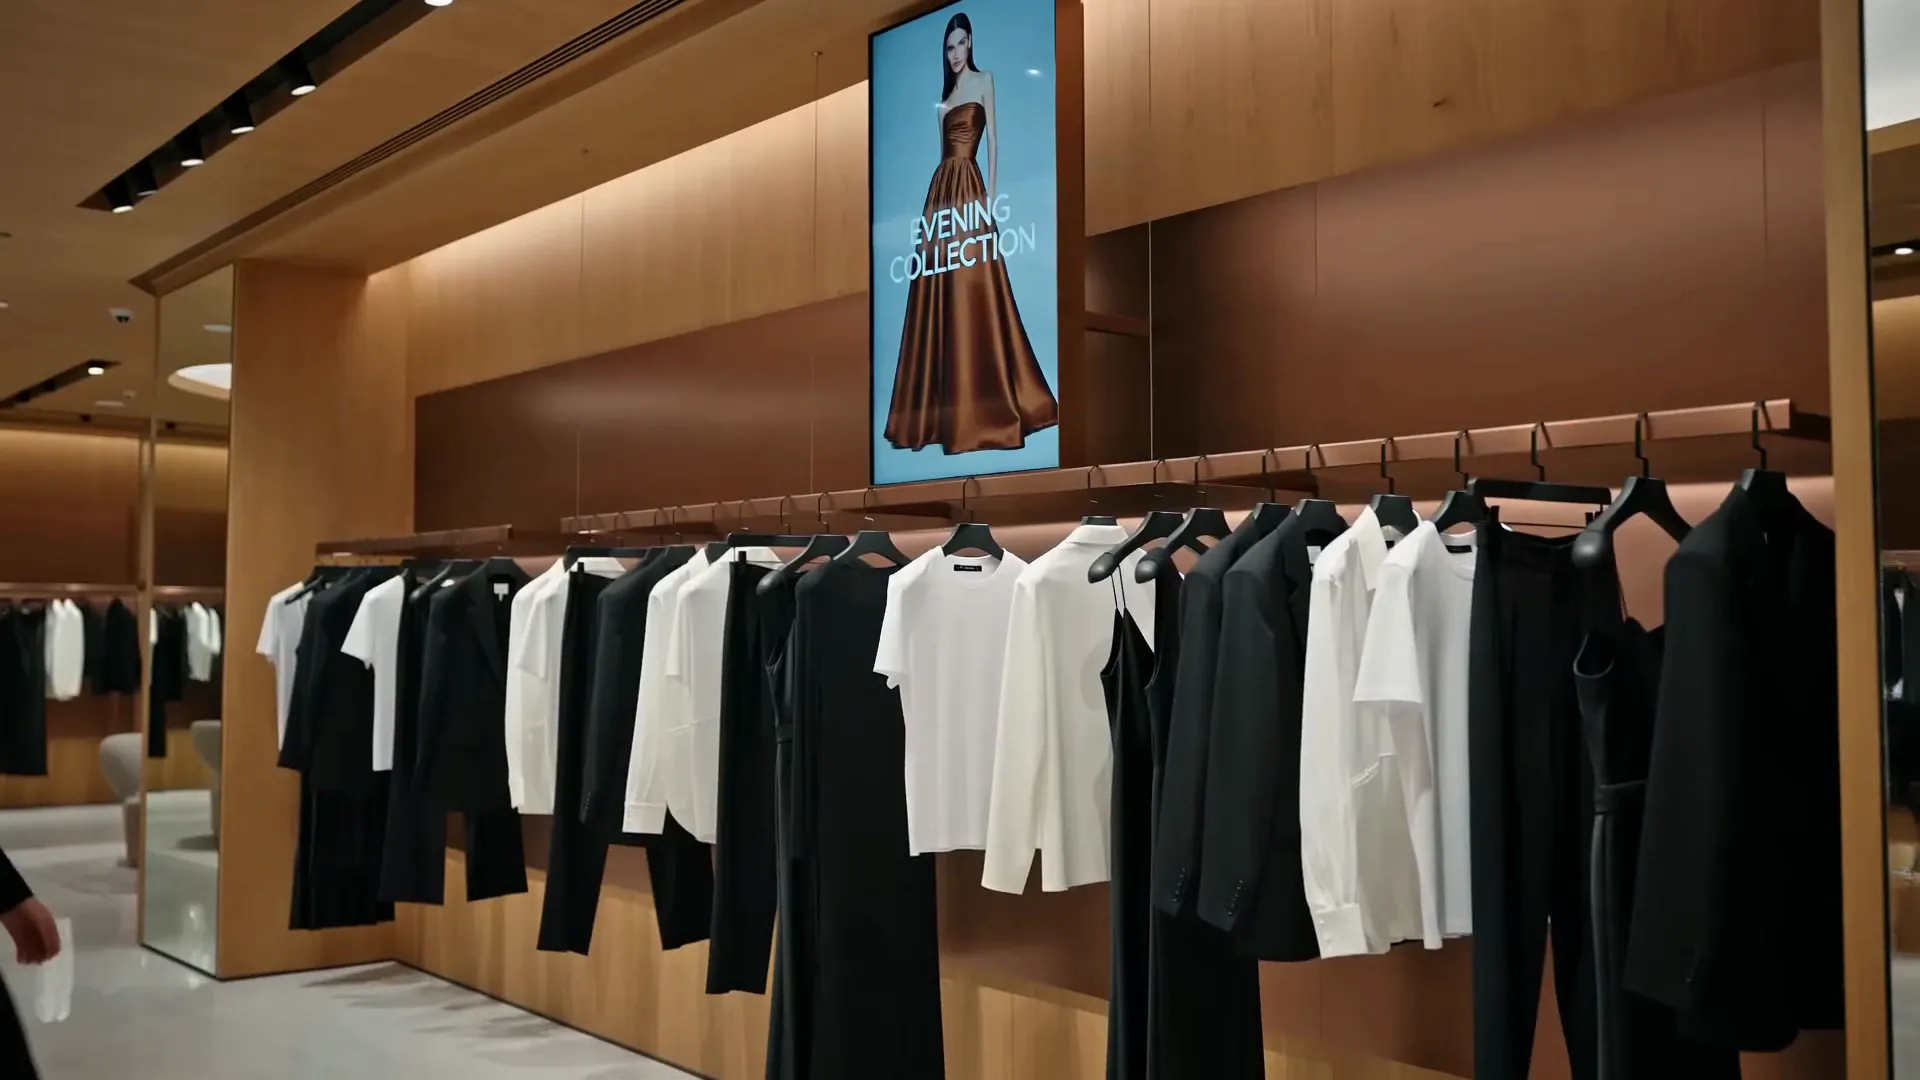
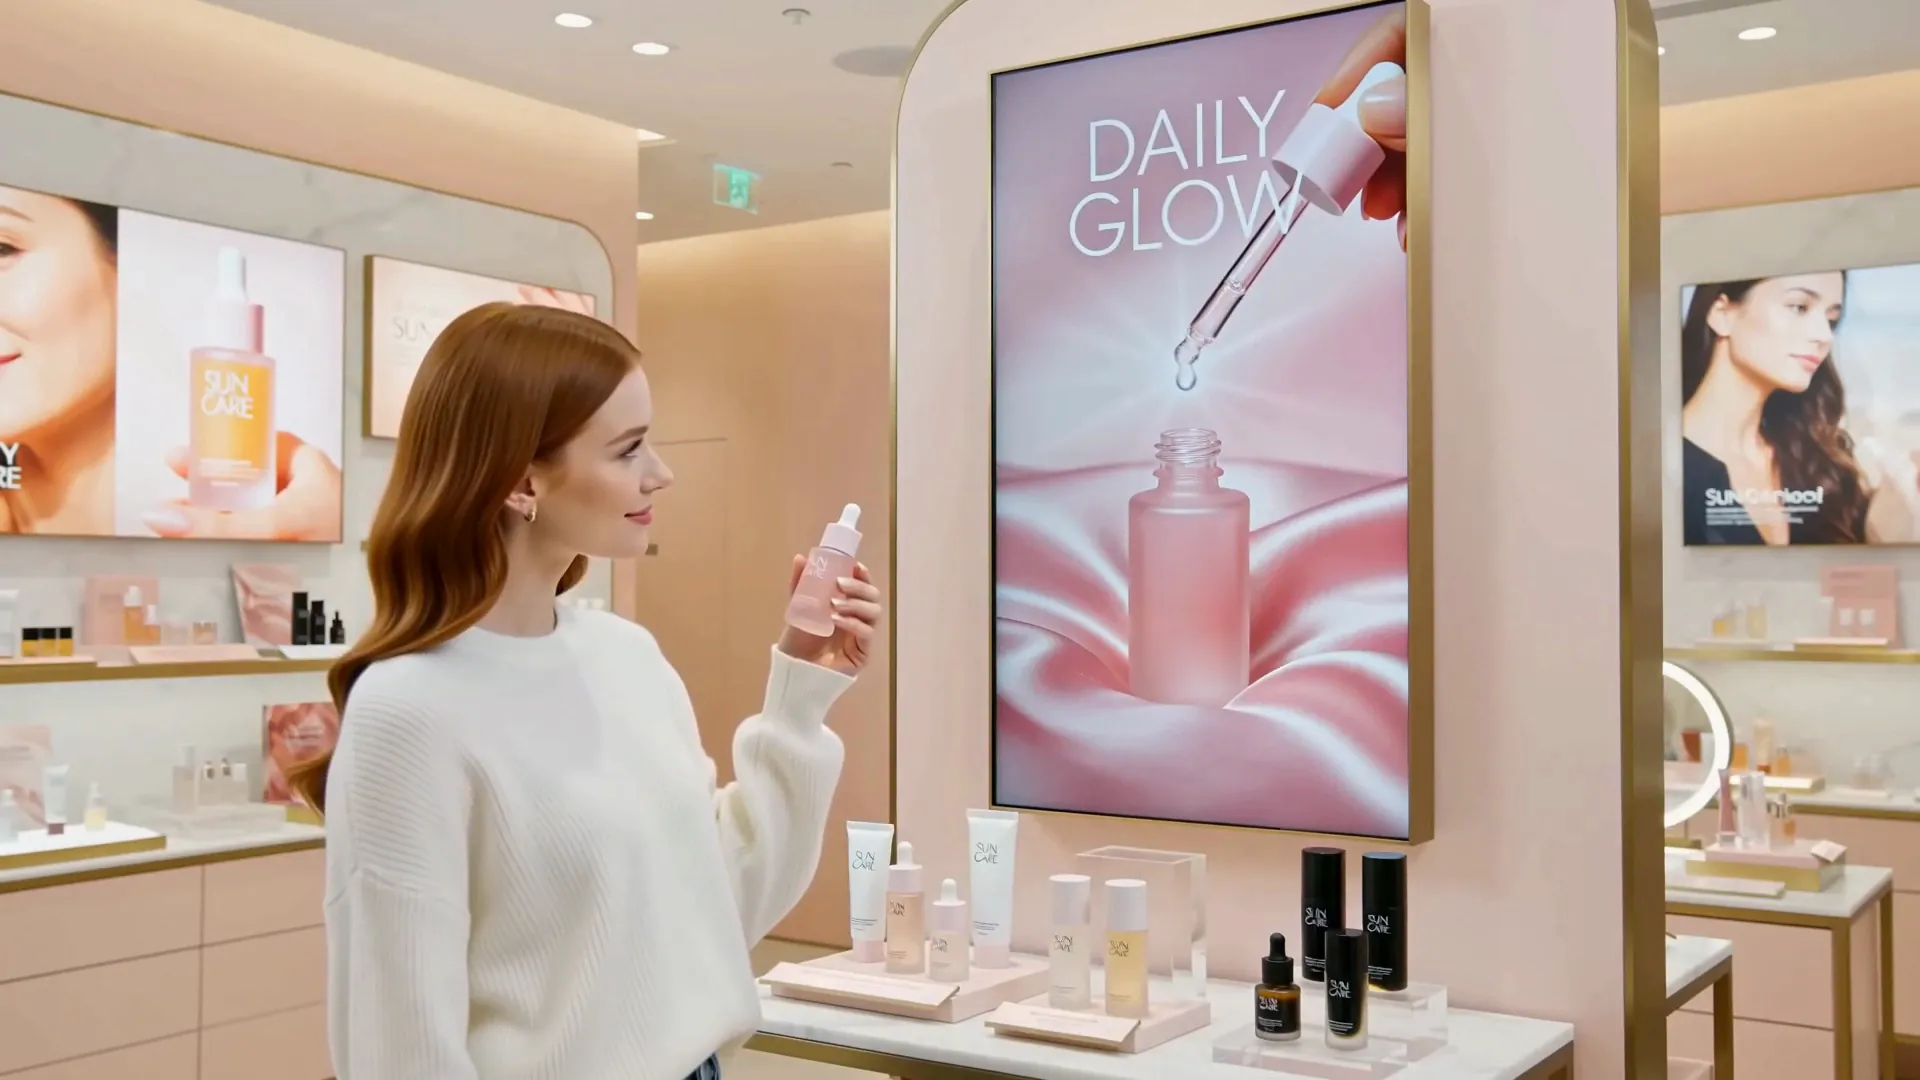
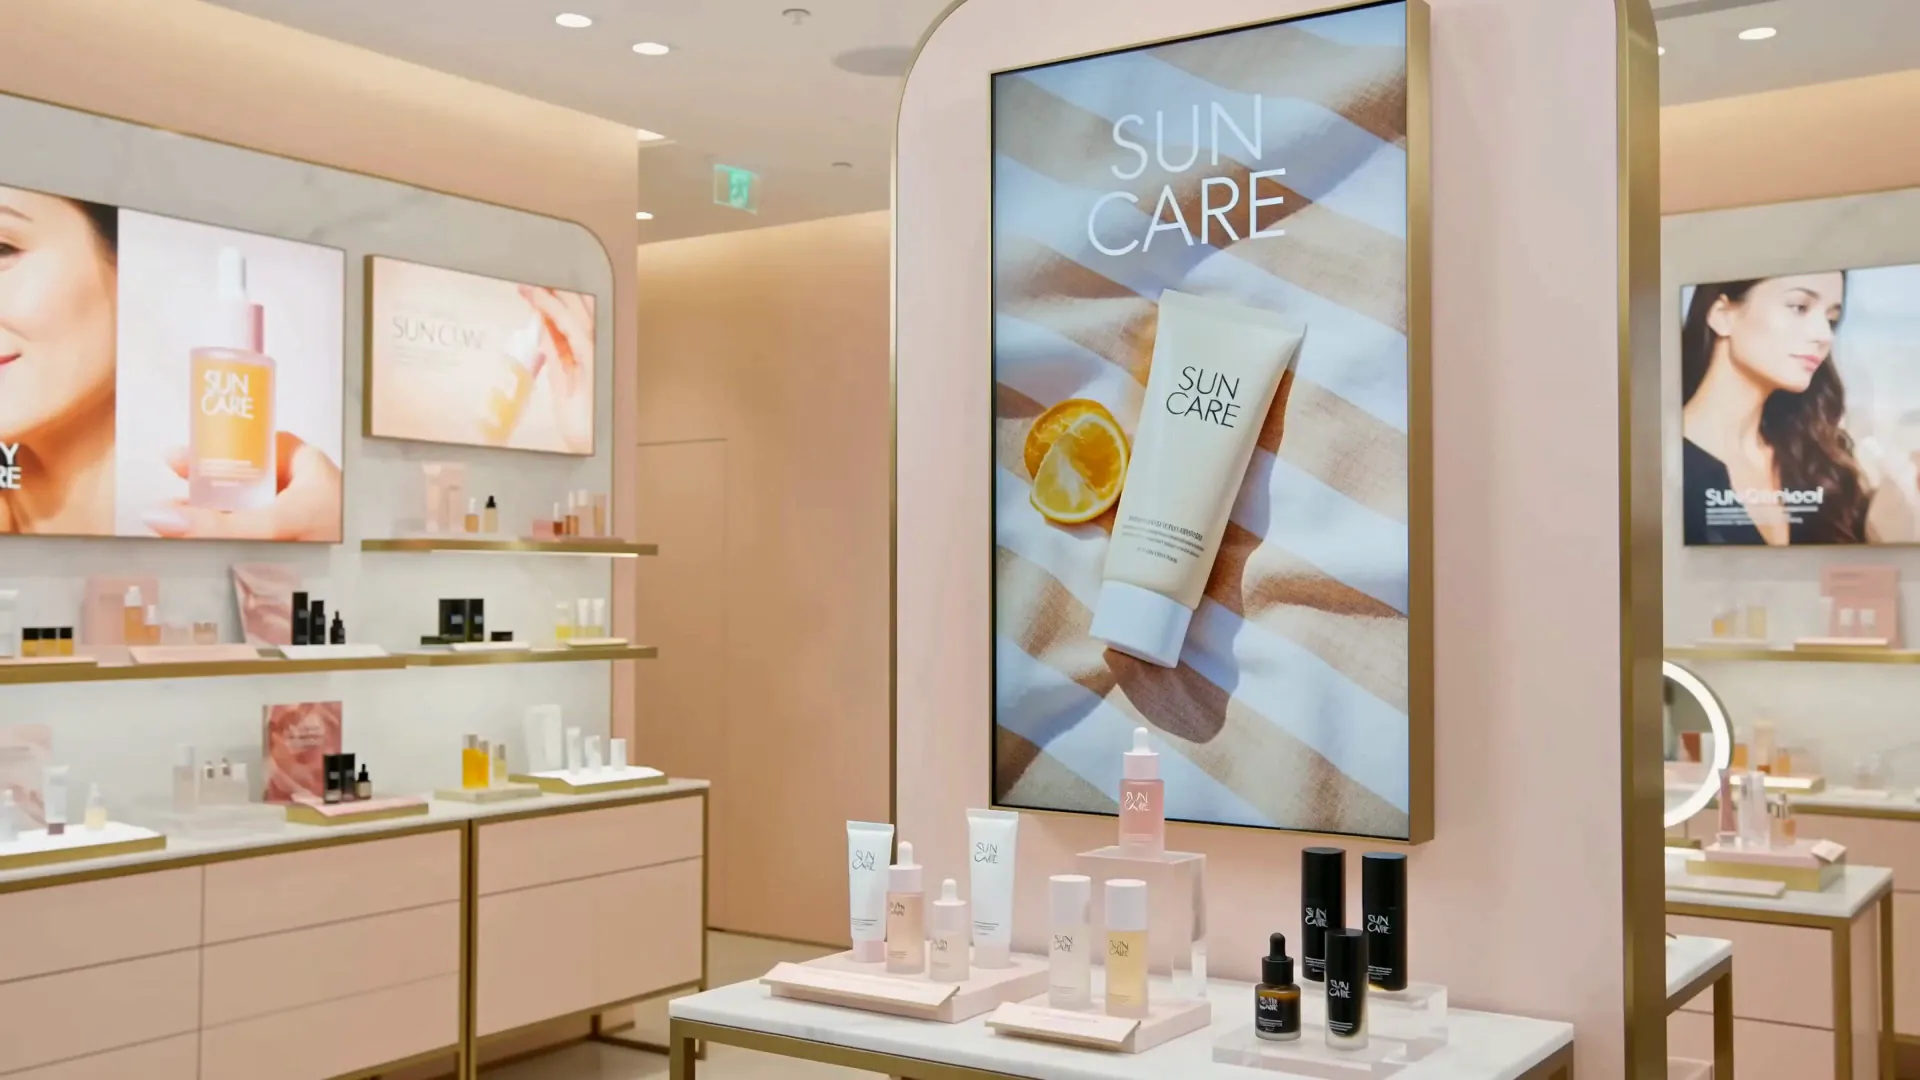
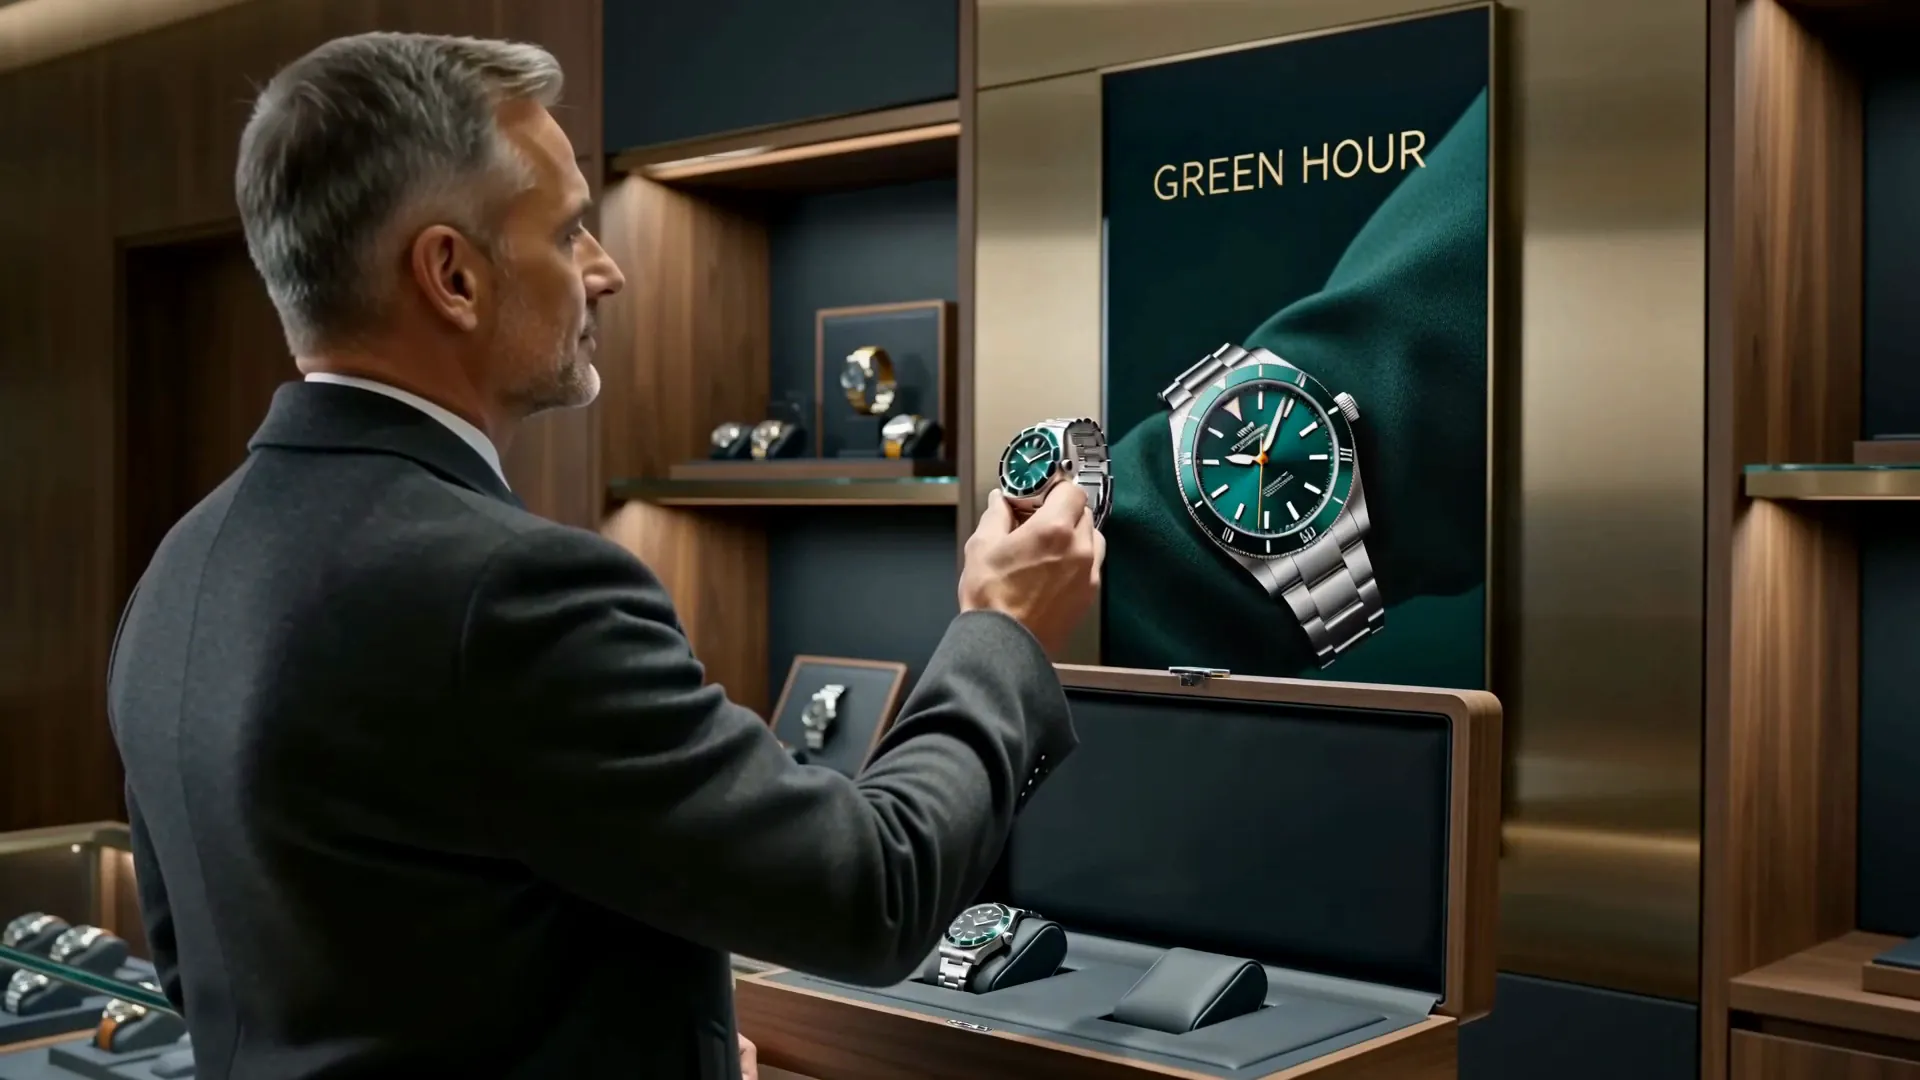
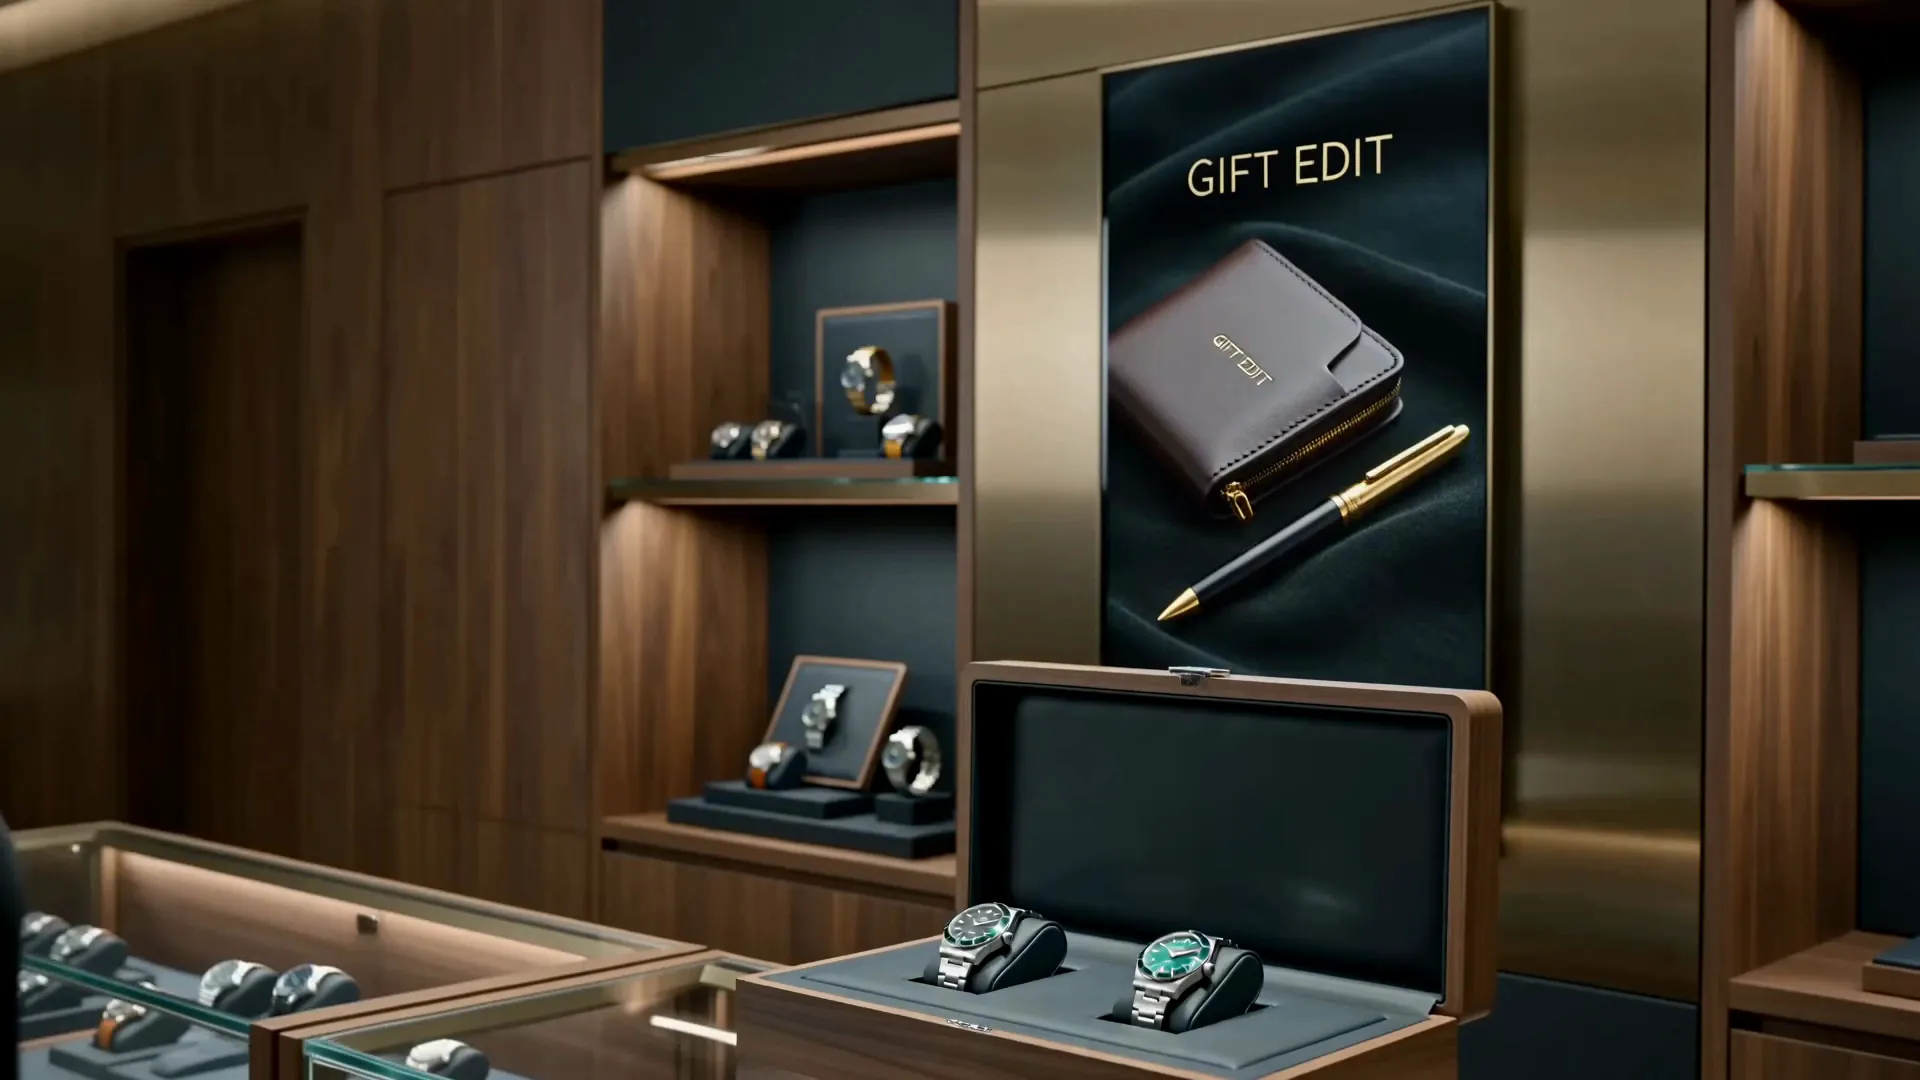
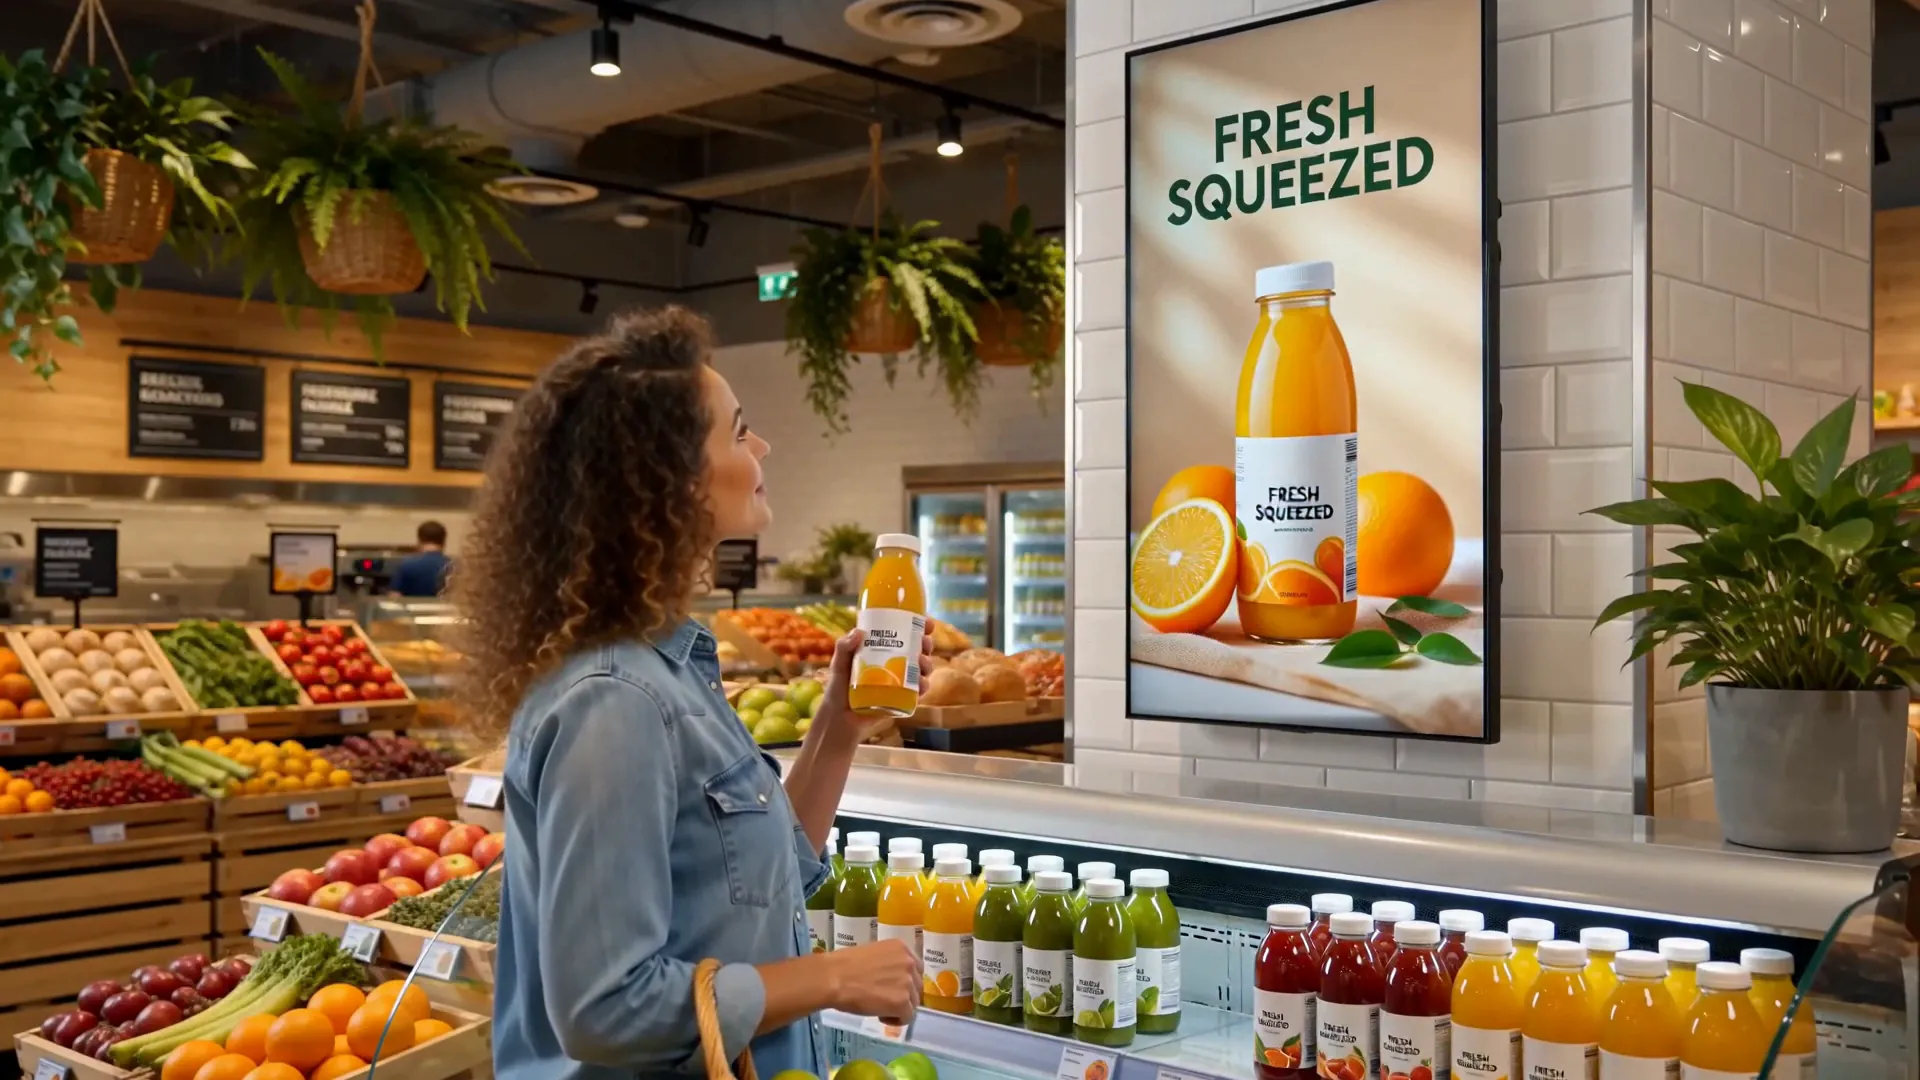
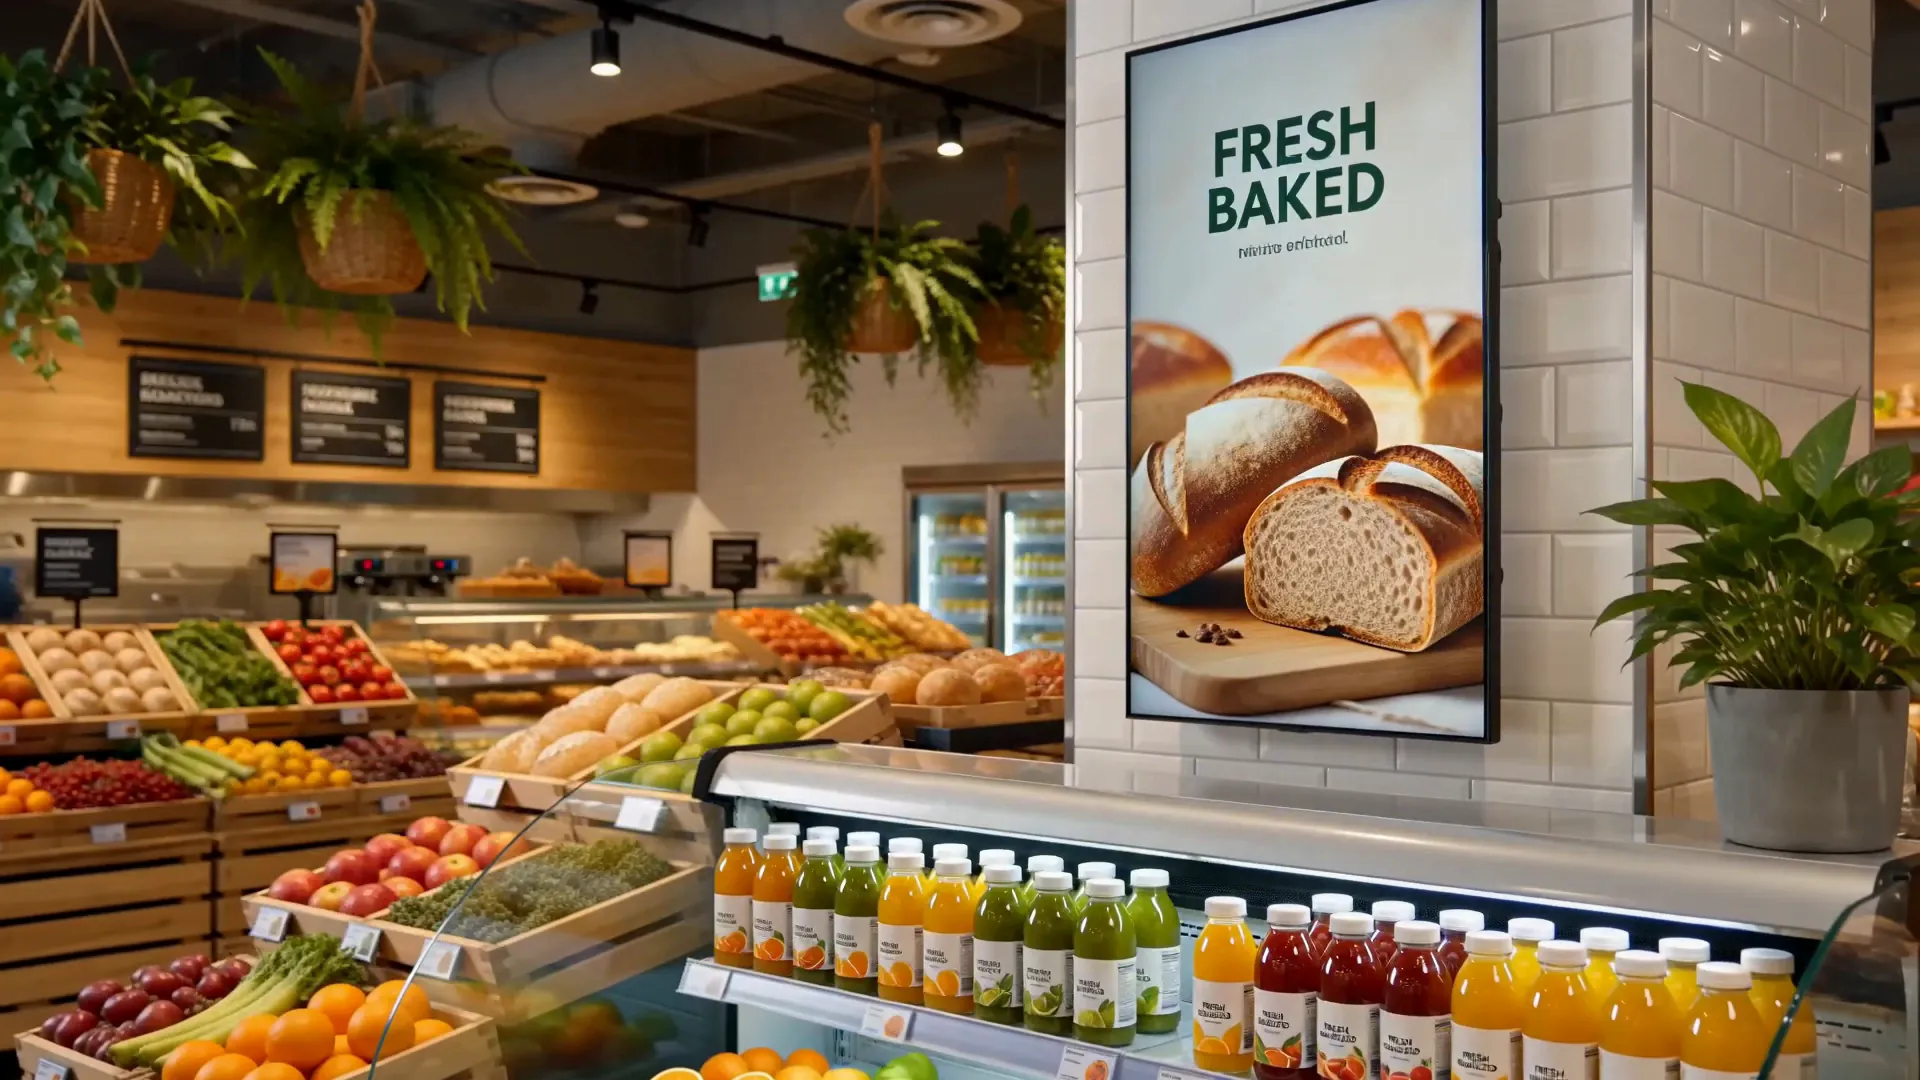
Or it can act the moment a product is picked up. The screen beside it is one option, not a requirement.

Measured on 30 September 2026 in GoTrack's test setup: 25 fires across 8 products; 24 reported their render back (one two-product fire did not). Timed on the store device's clock from the moment GoTrack decided which product was in hand until the screen reported the product content painted, including that report's trip back. The time from lifting a product to that decision is not included here; we will publish it once it is measured. How we measured it
GoTrack can change what a screen shows, then measure whether shoppers picked up and held the product more than in a period without it.
Every category comes with its own question.
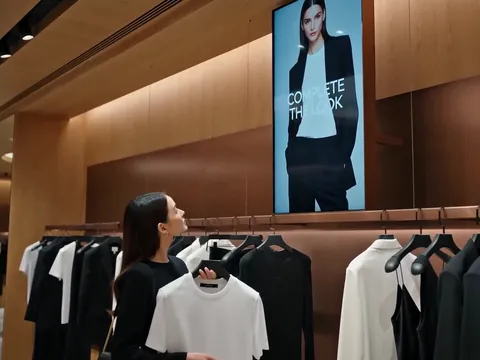 In storesApparelWhich colours get picked up, and which go straight back?Pickups, hold time and put-backs per style and colour, and which styles are tried against each other.
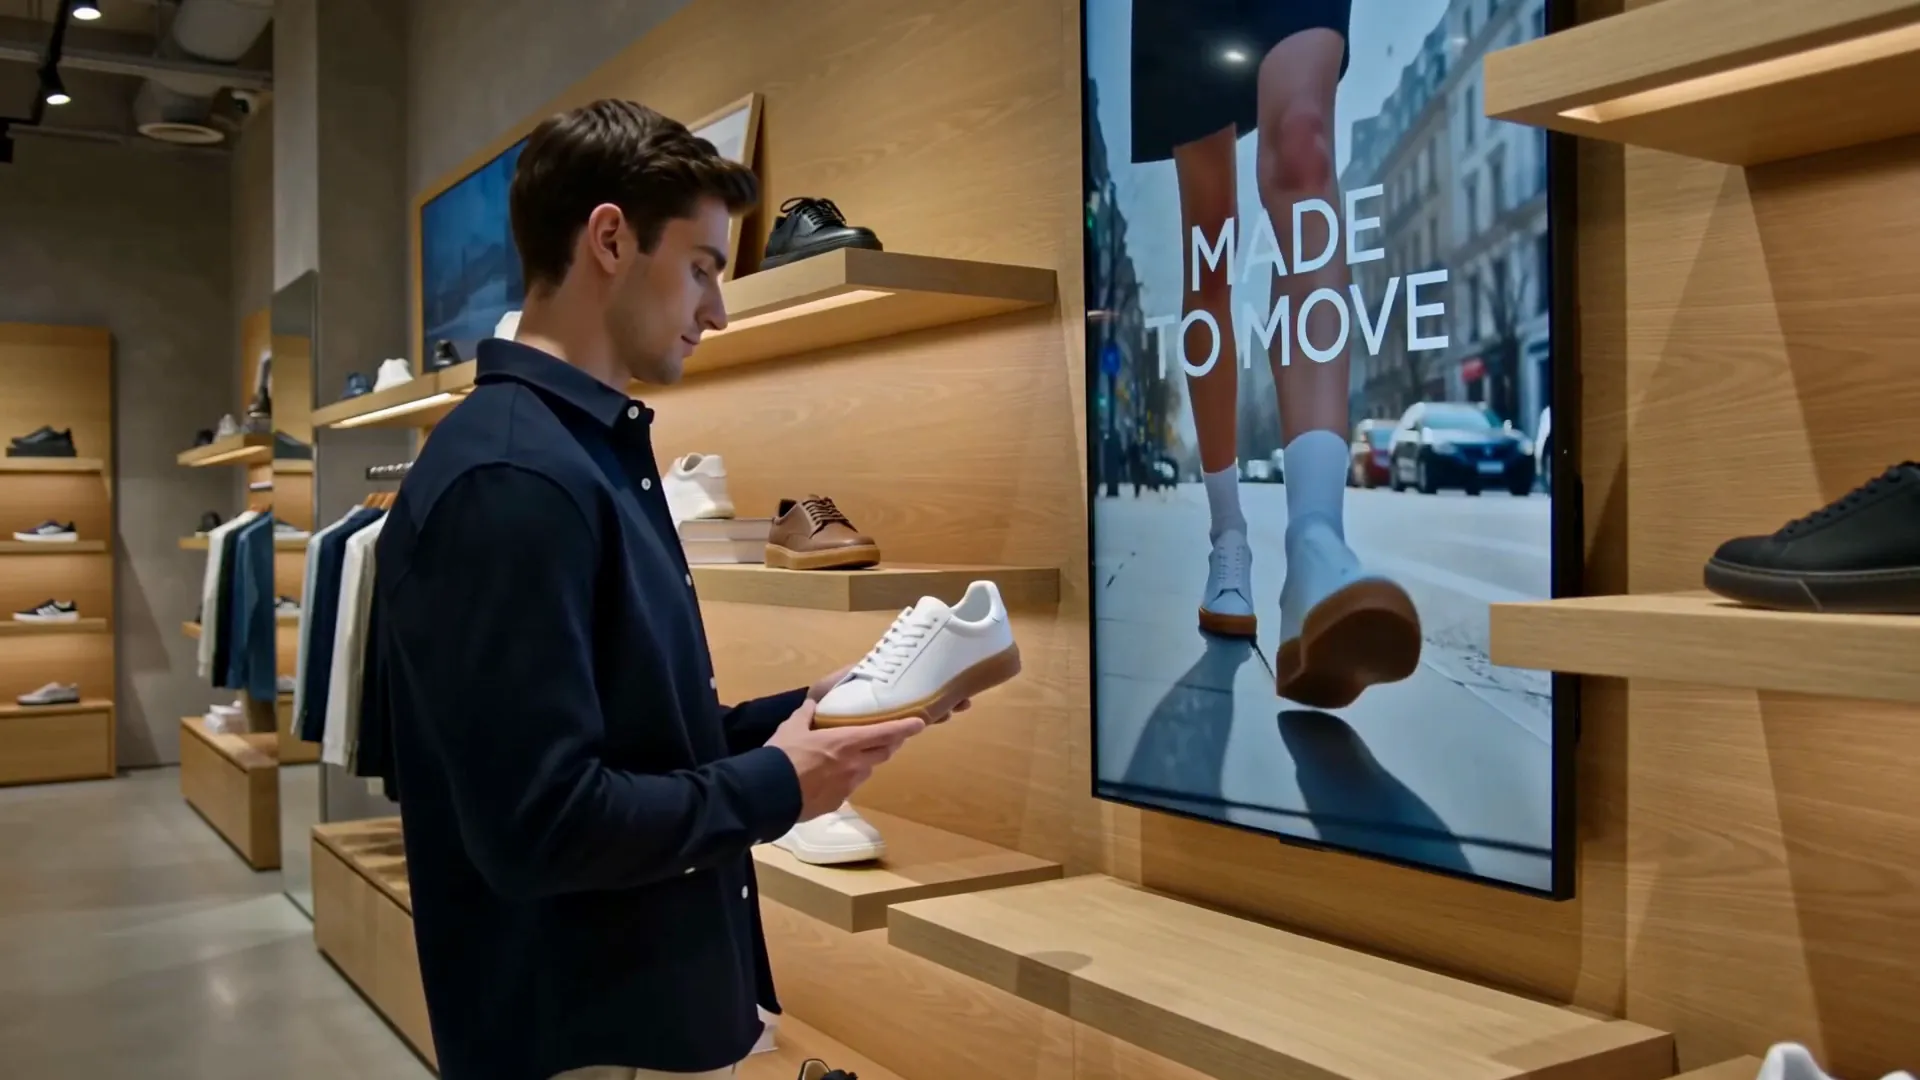
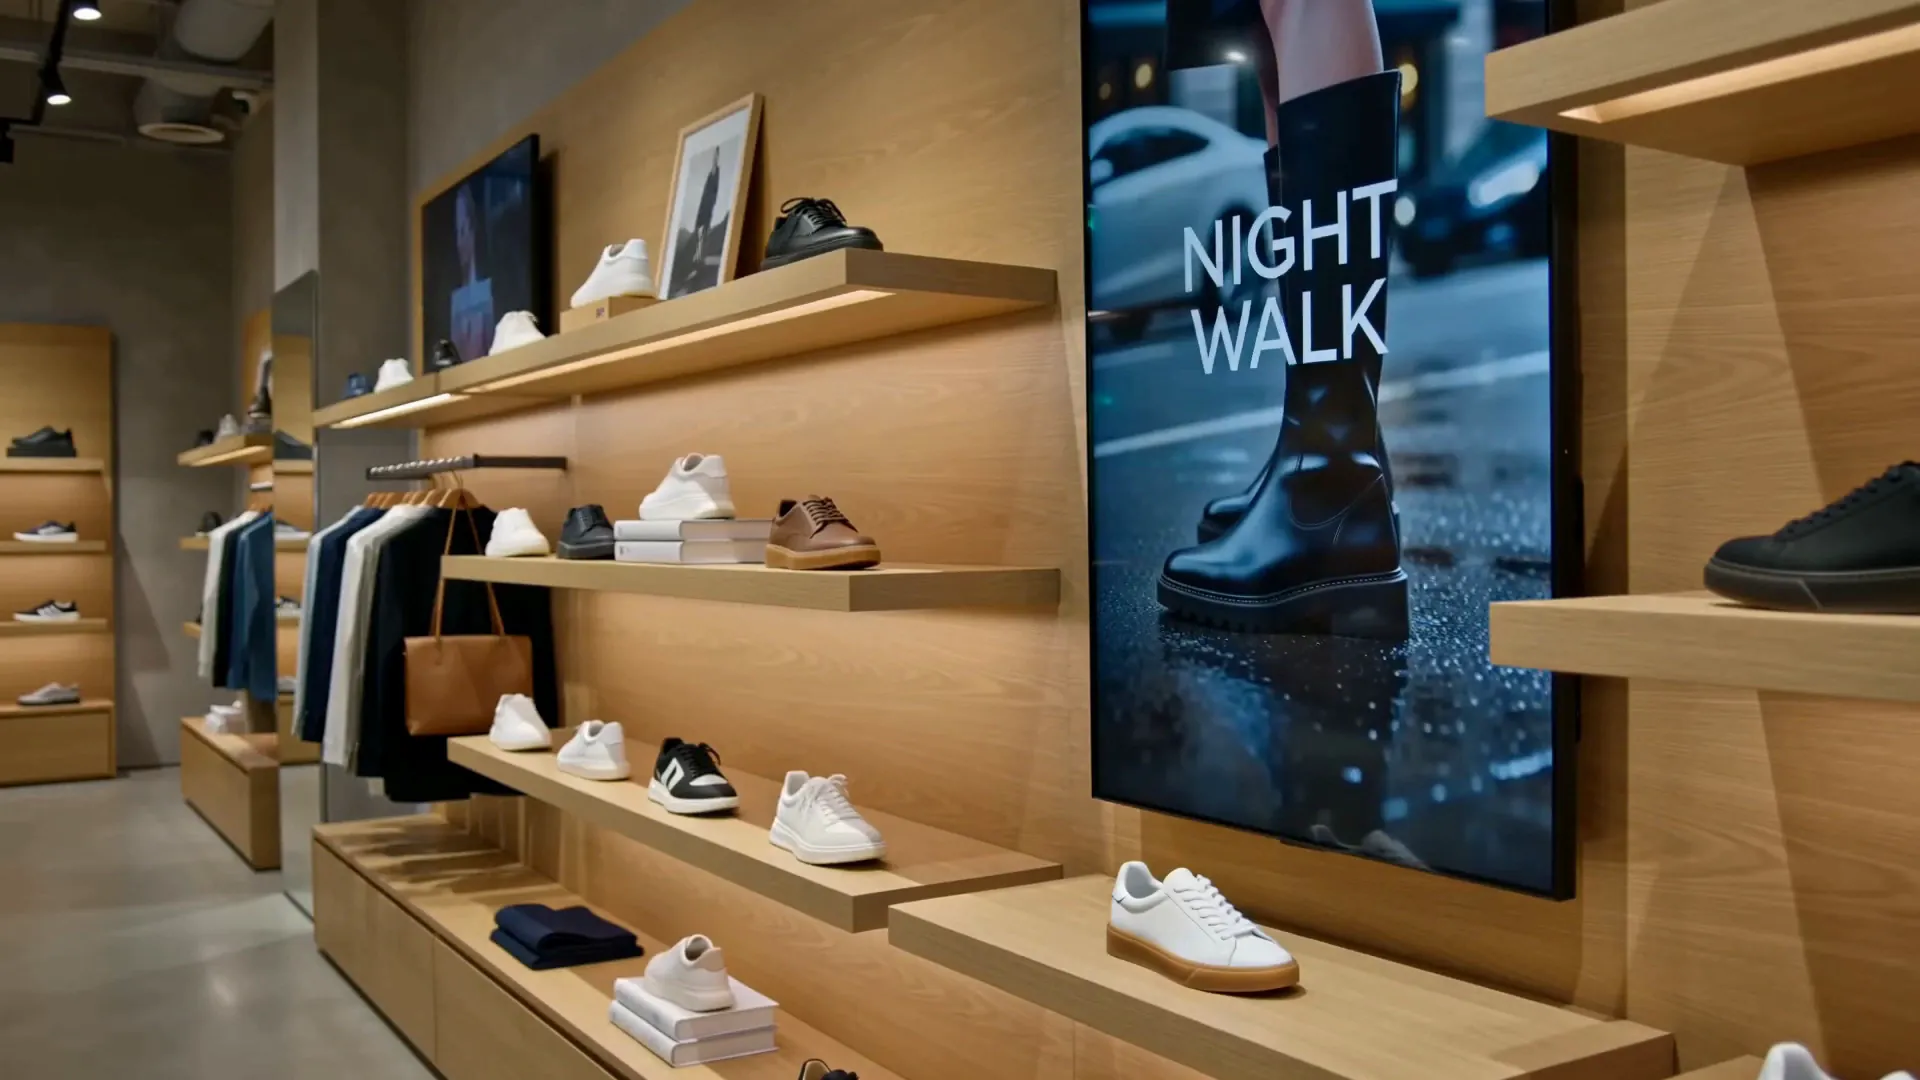
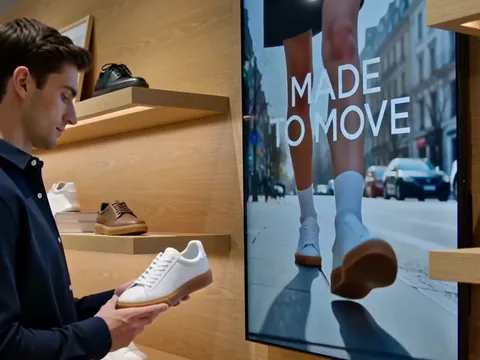 In storesFootwearWhich models are compared most often?Which models on the wall are lifted, how long each is inspected and which pairs are compared.
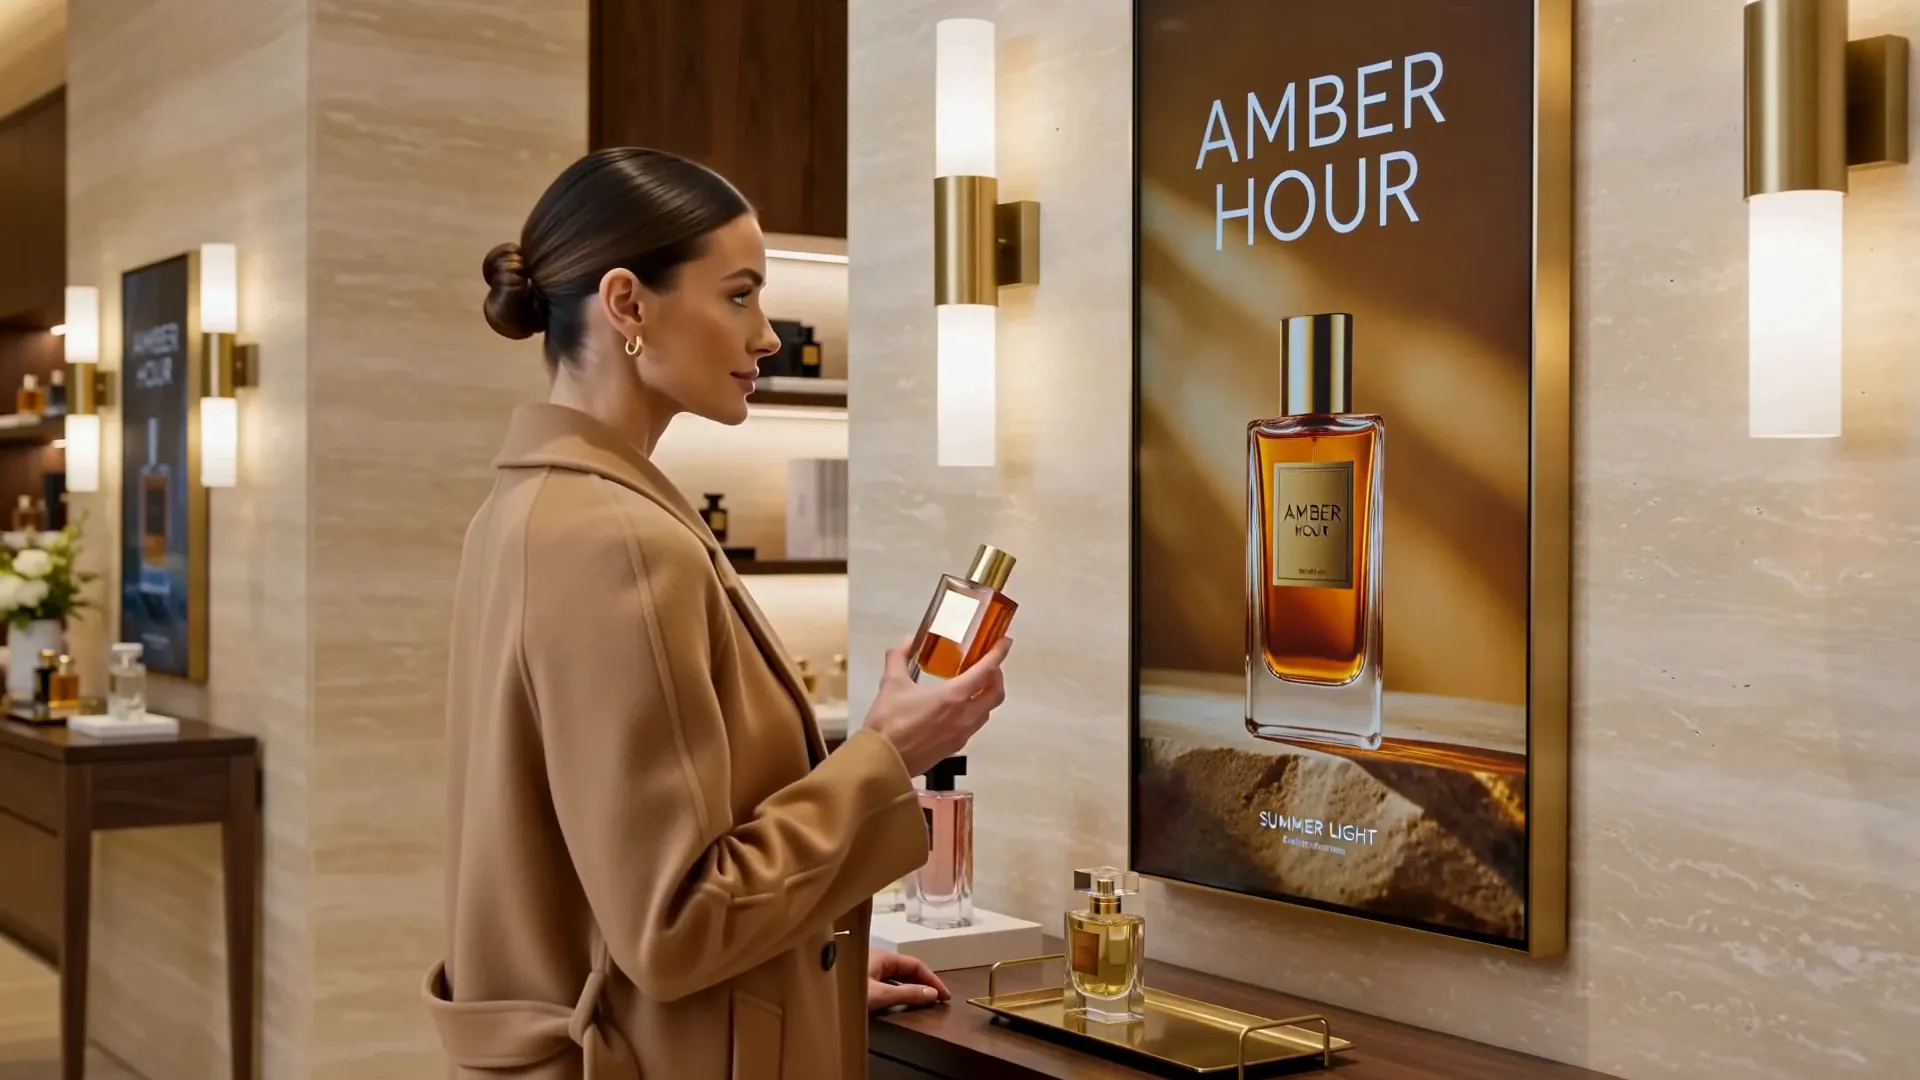
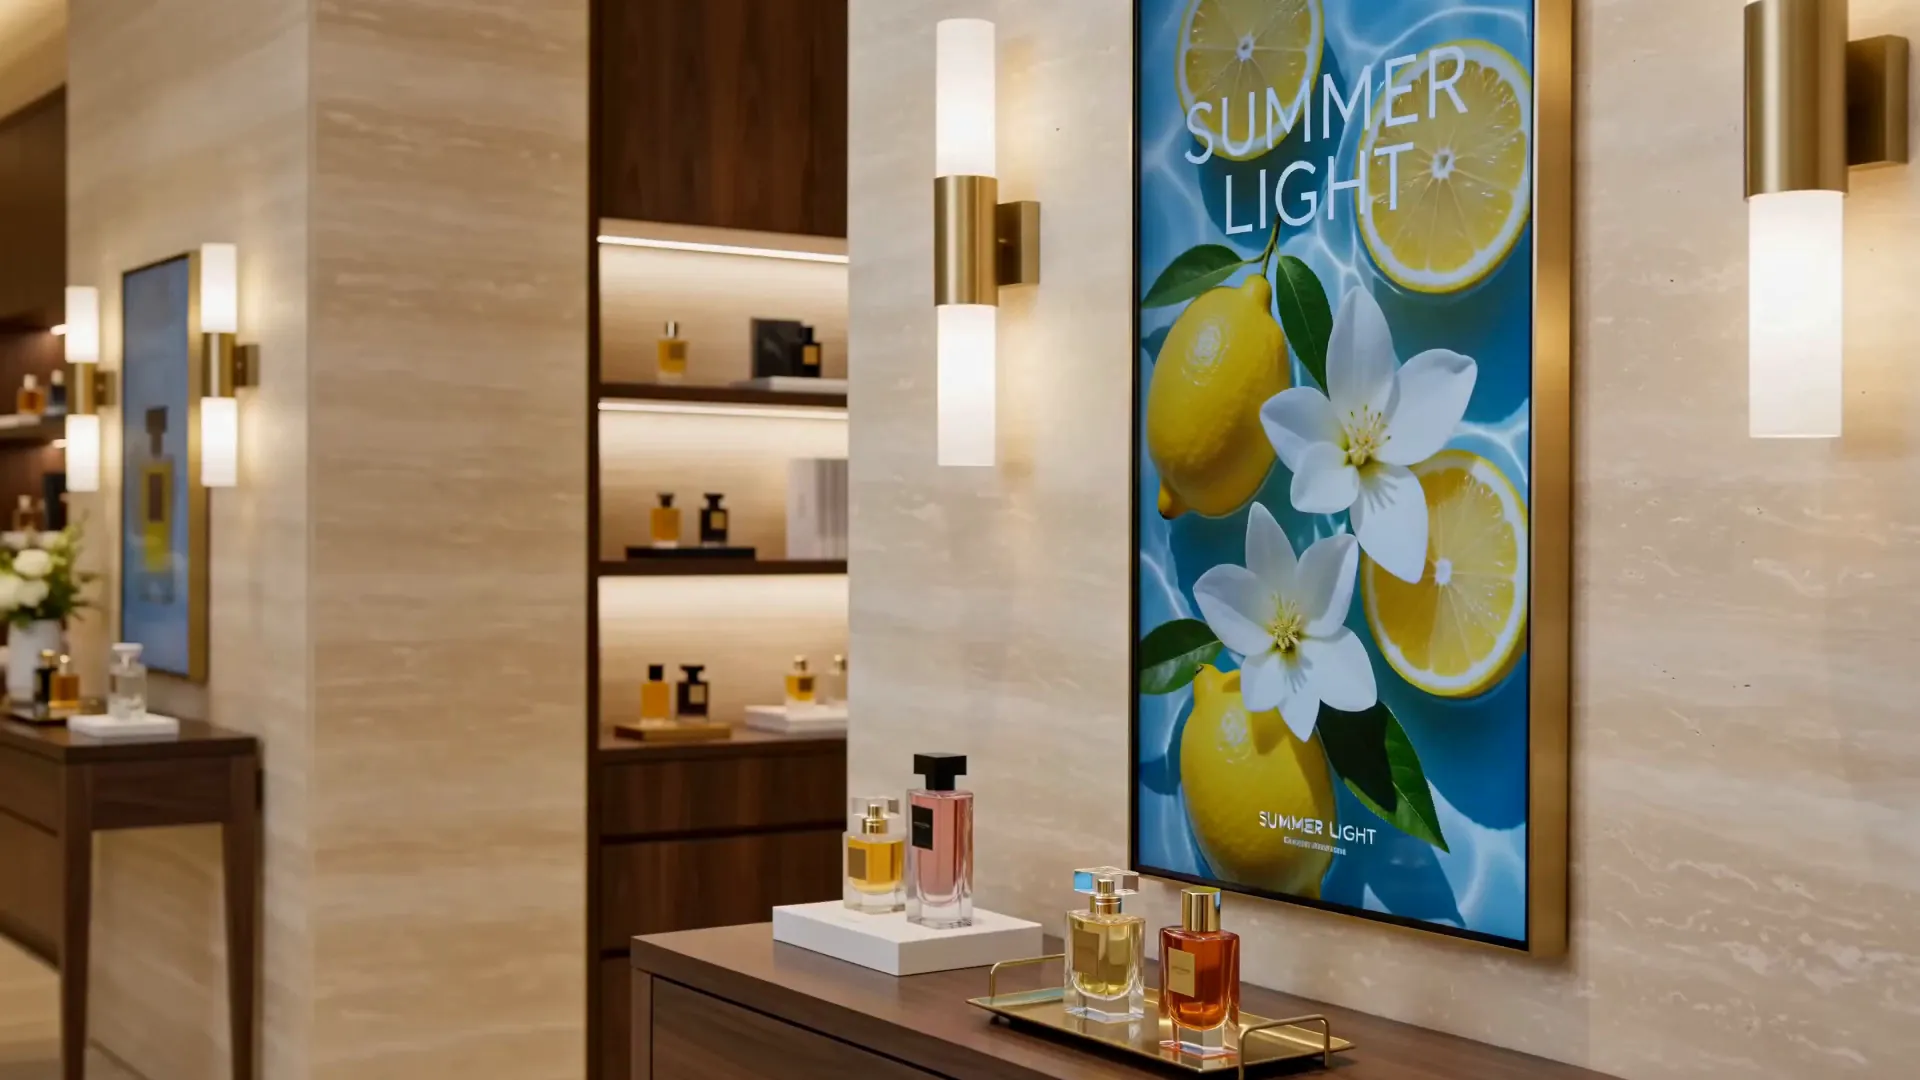
 Pilot firstFragranceWhich fragrance is held the longest?Which bottles leave the tray, how long each is held and which are tried one after another.
 Pilot firstCosmeticsWhich shades are picked up and put back?Pickups and put-backs per product and shade, and which products are picked up together.
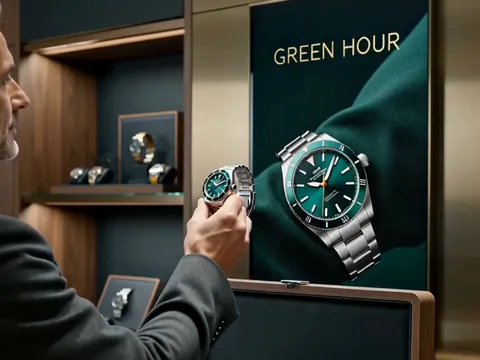 Pilot firstWatchesWhich pieces are held longest before they go back?Which pieces leave the display, how long they are held and how often they go back.
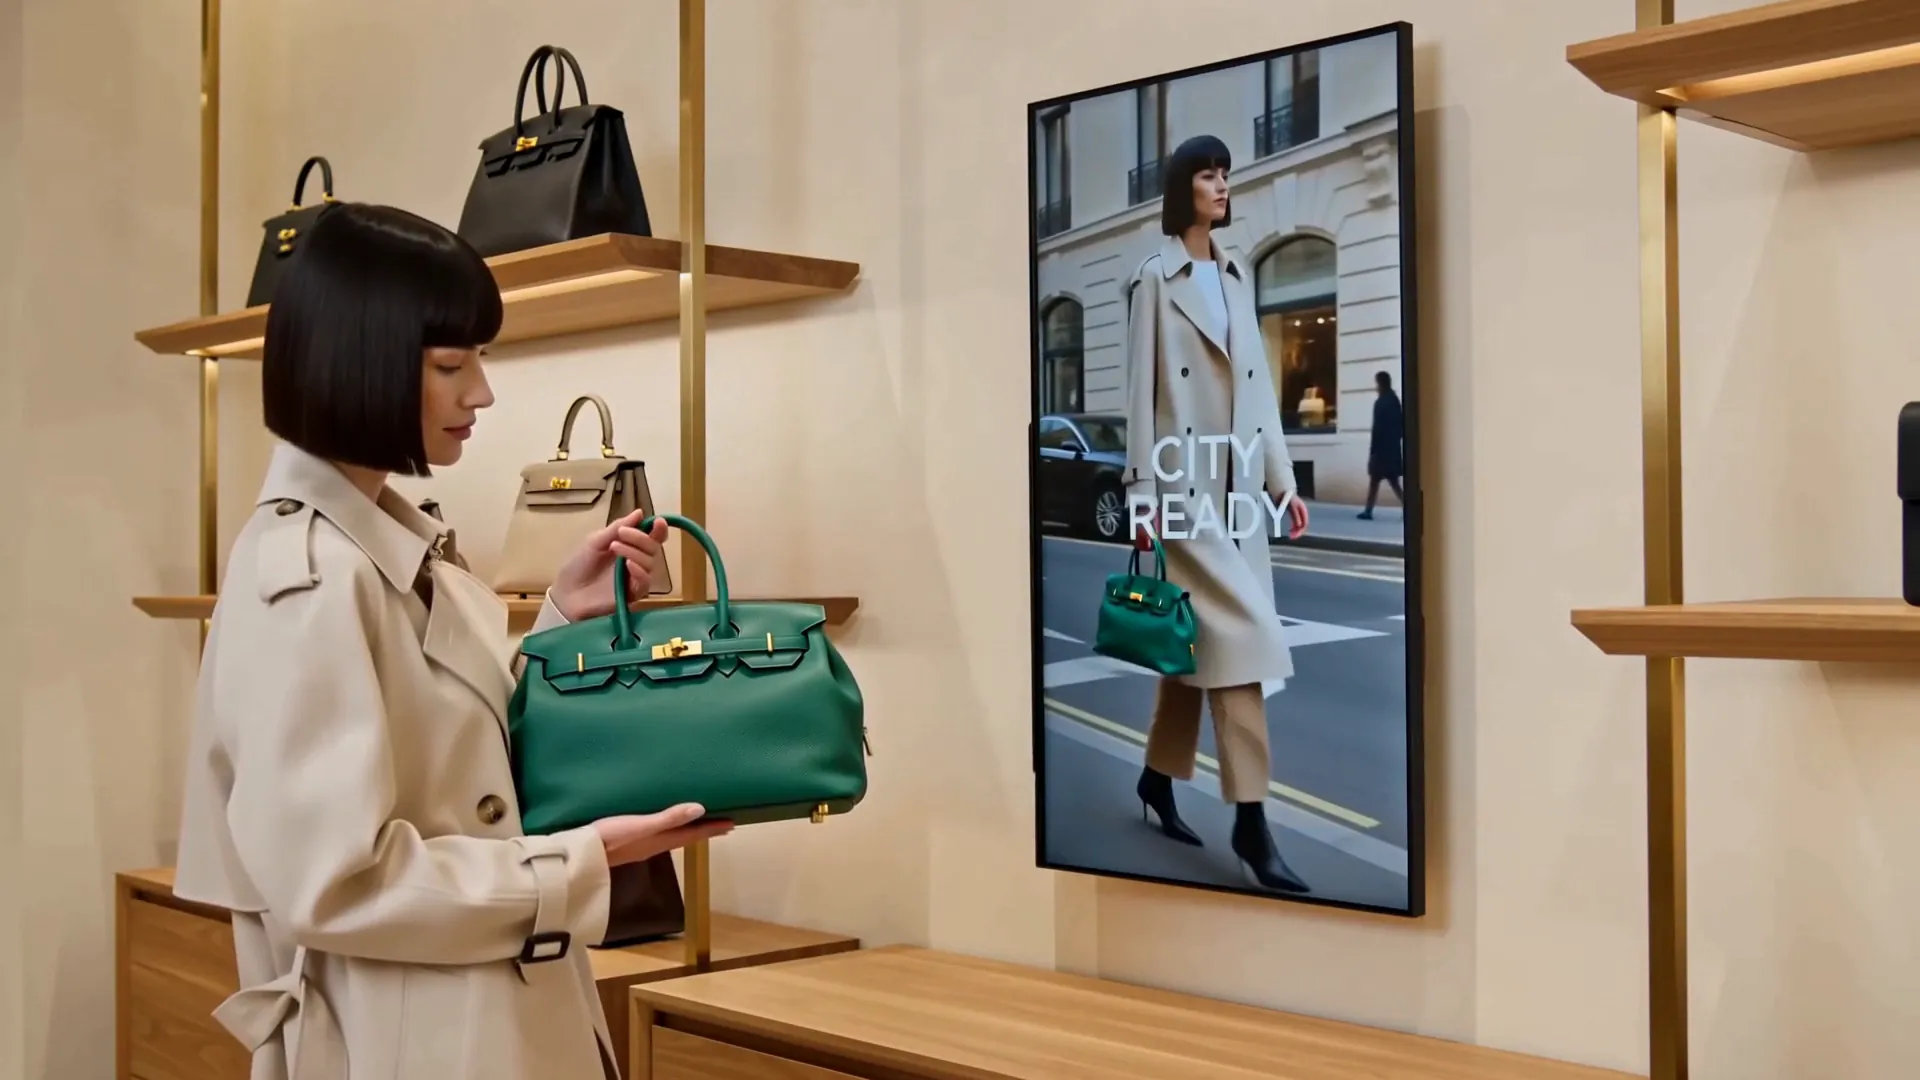
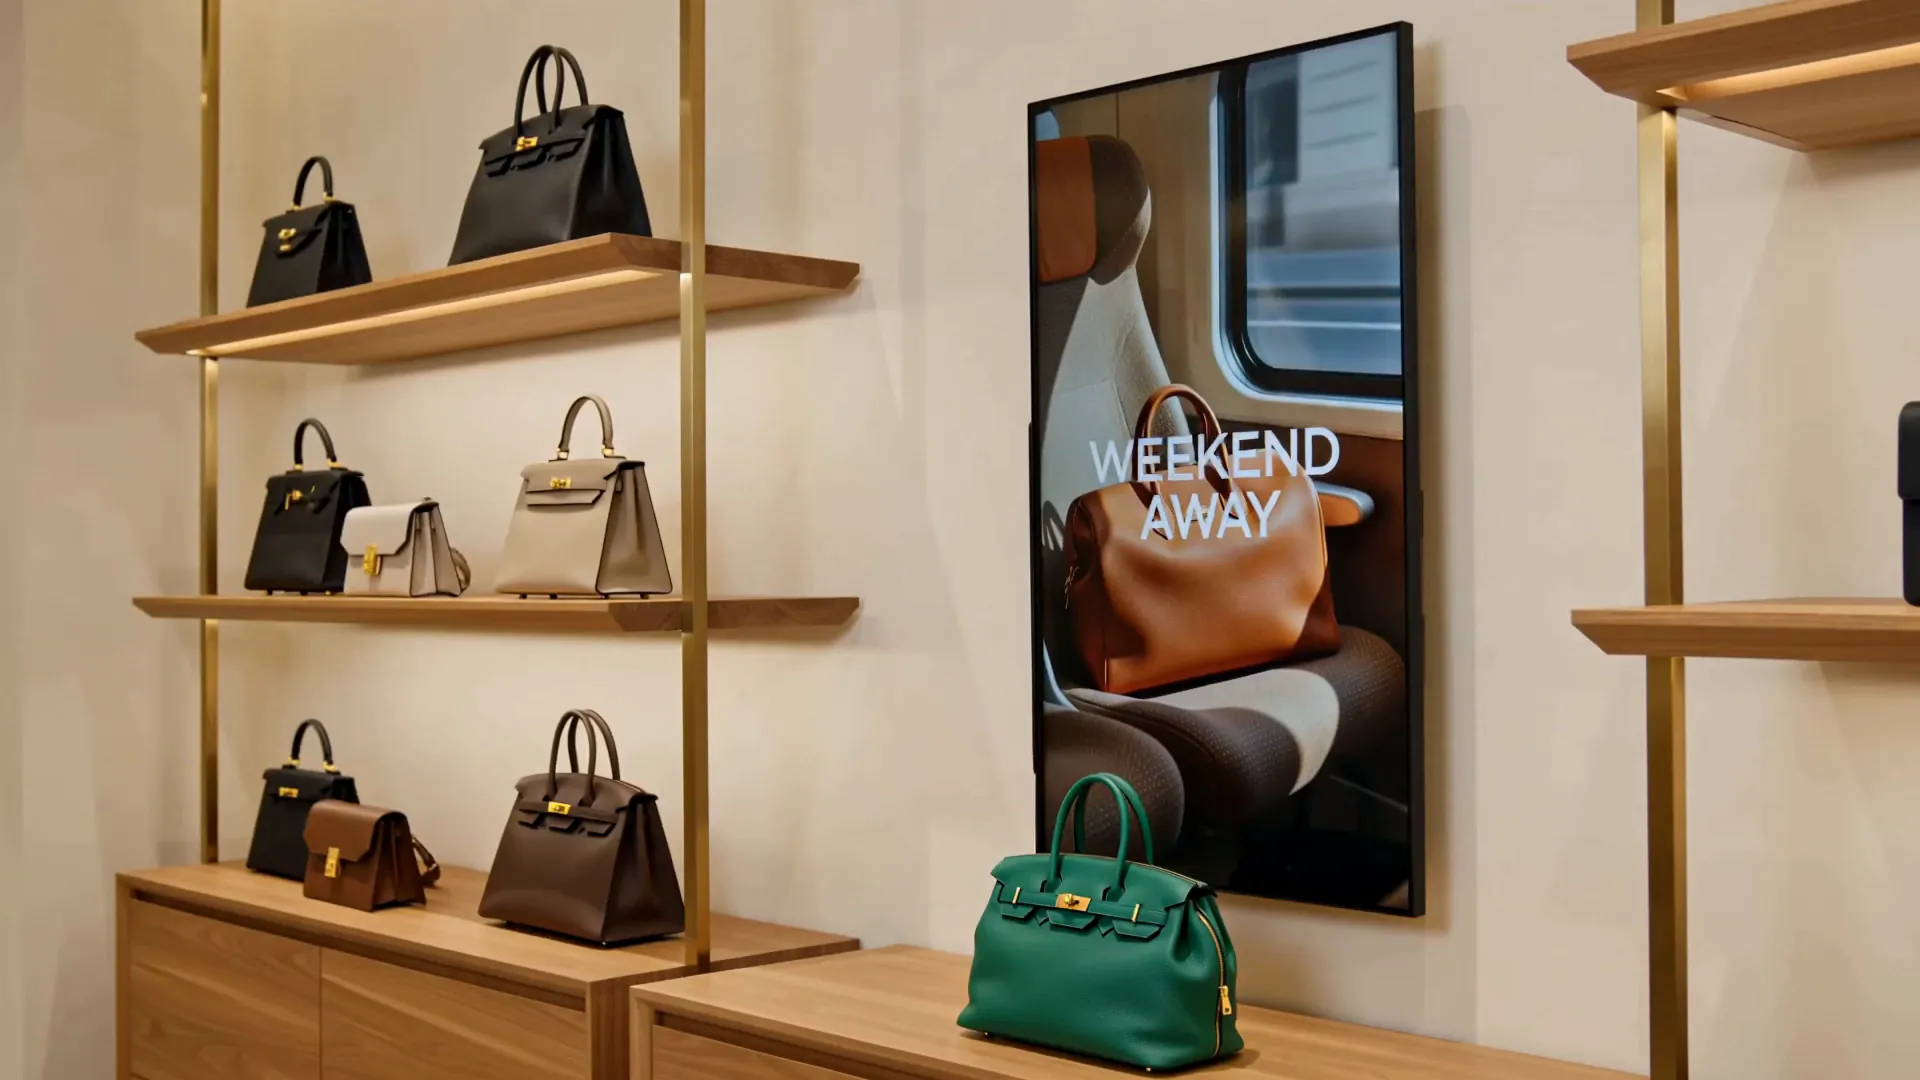
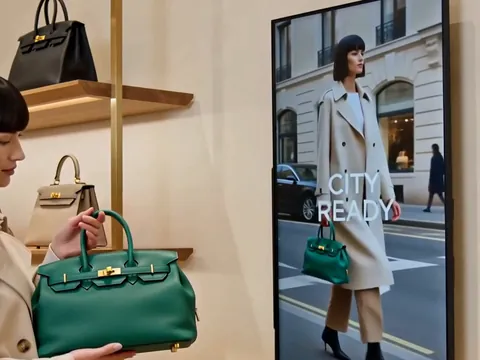 Pilot firstBagsWhich bags draw hands in which store?Pickups and hold time per model and colour, store by store.
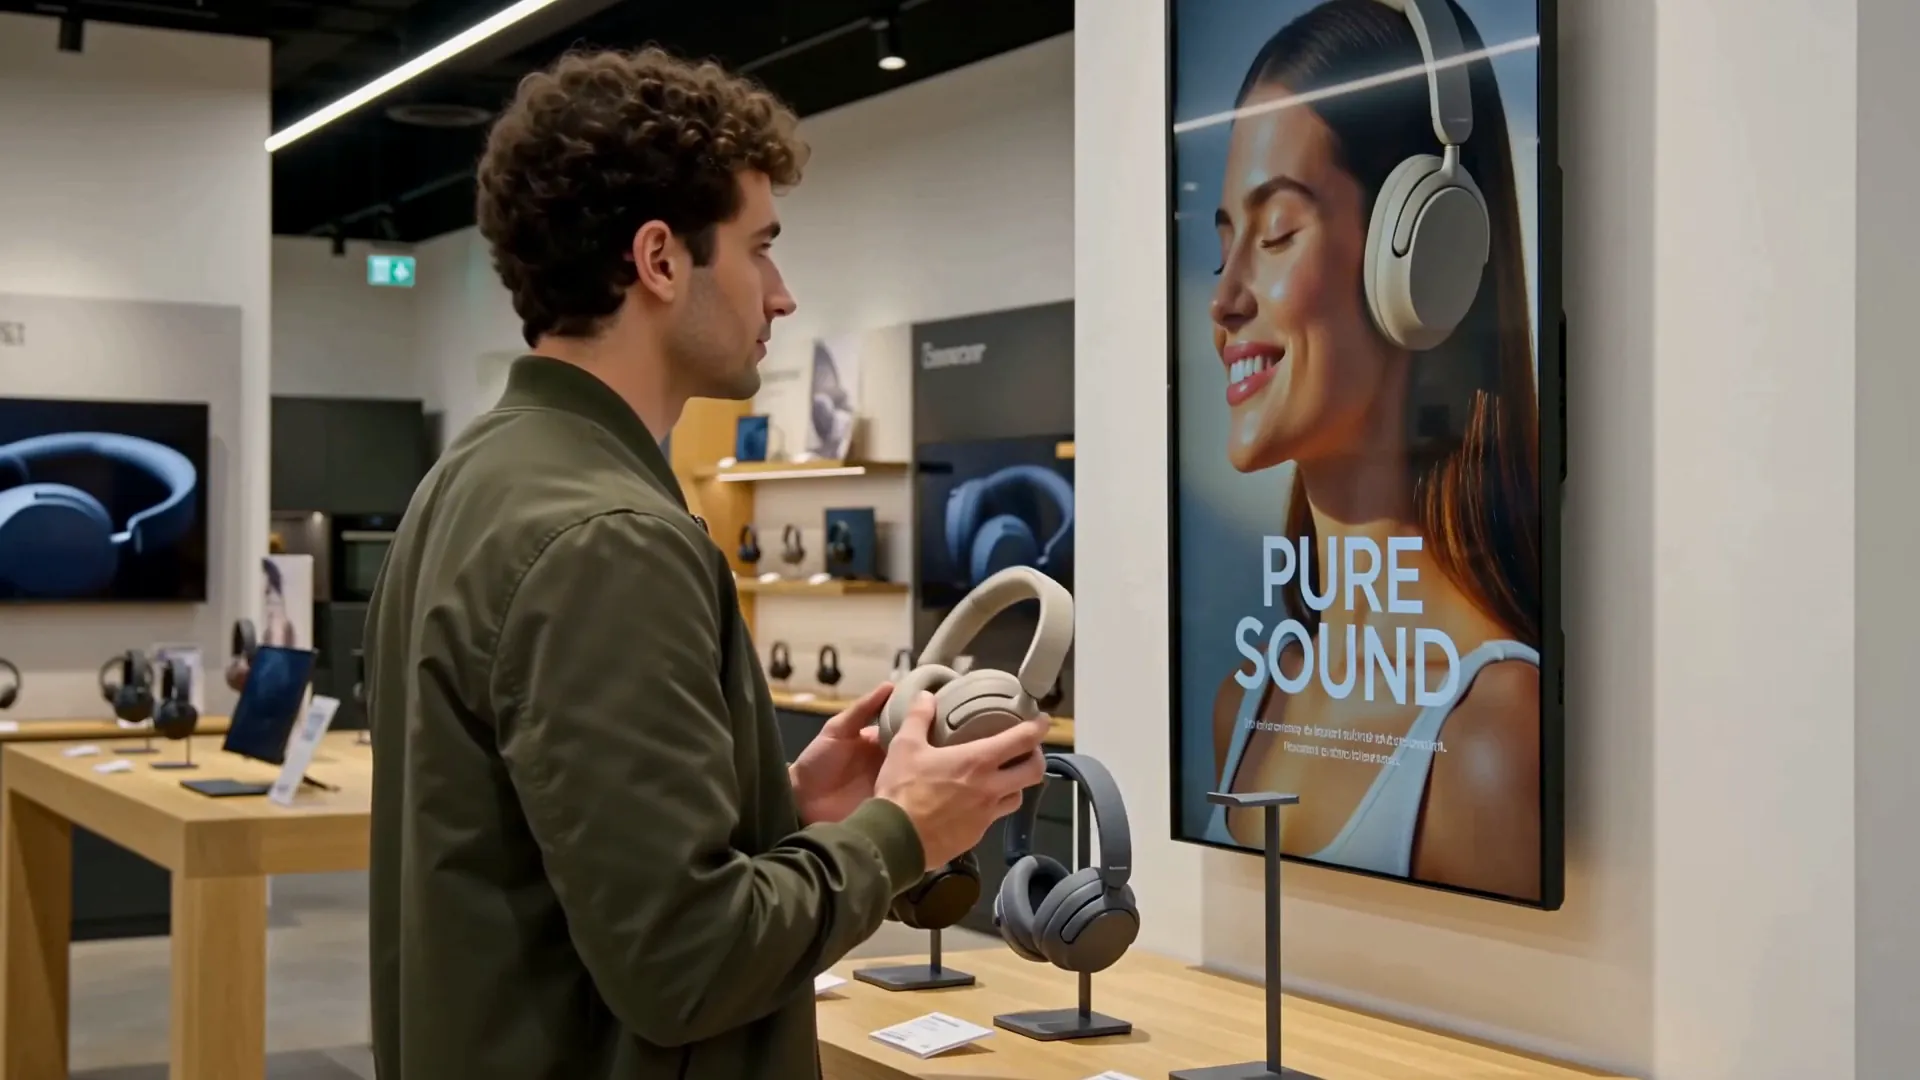
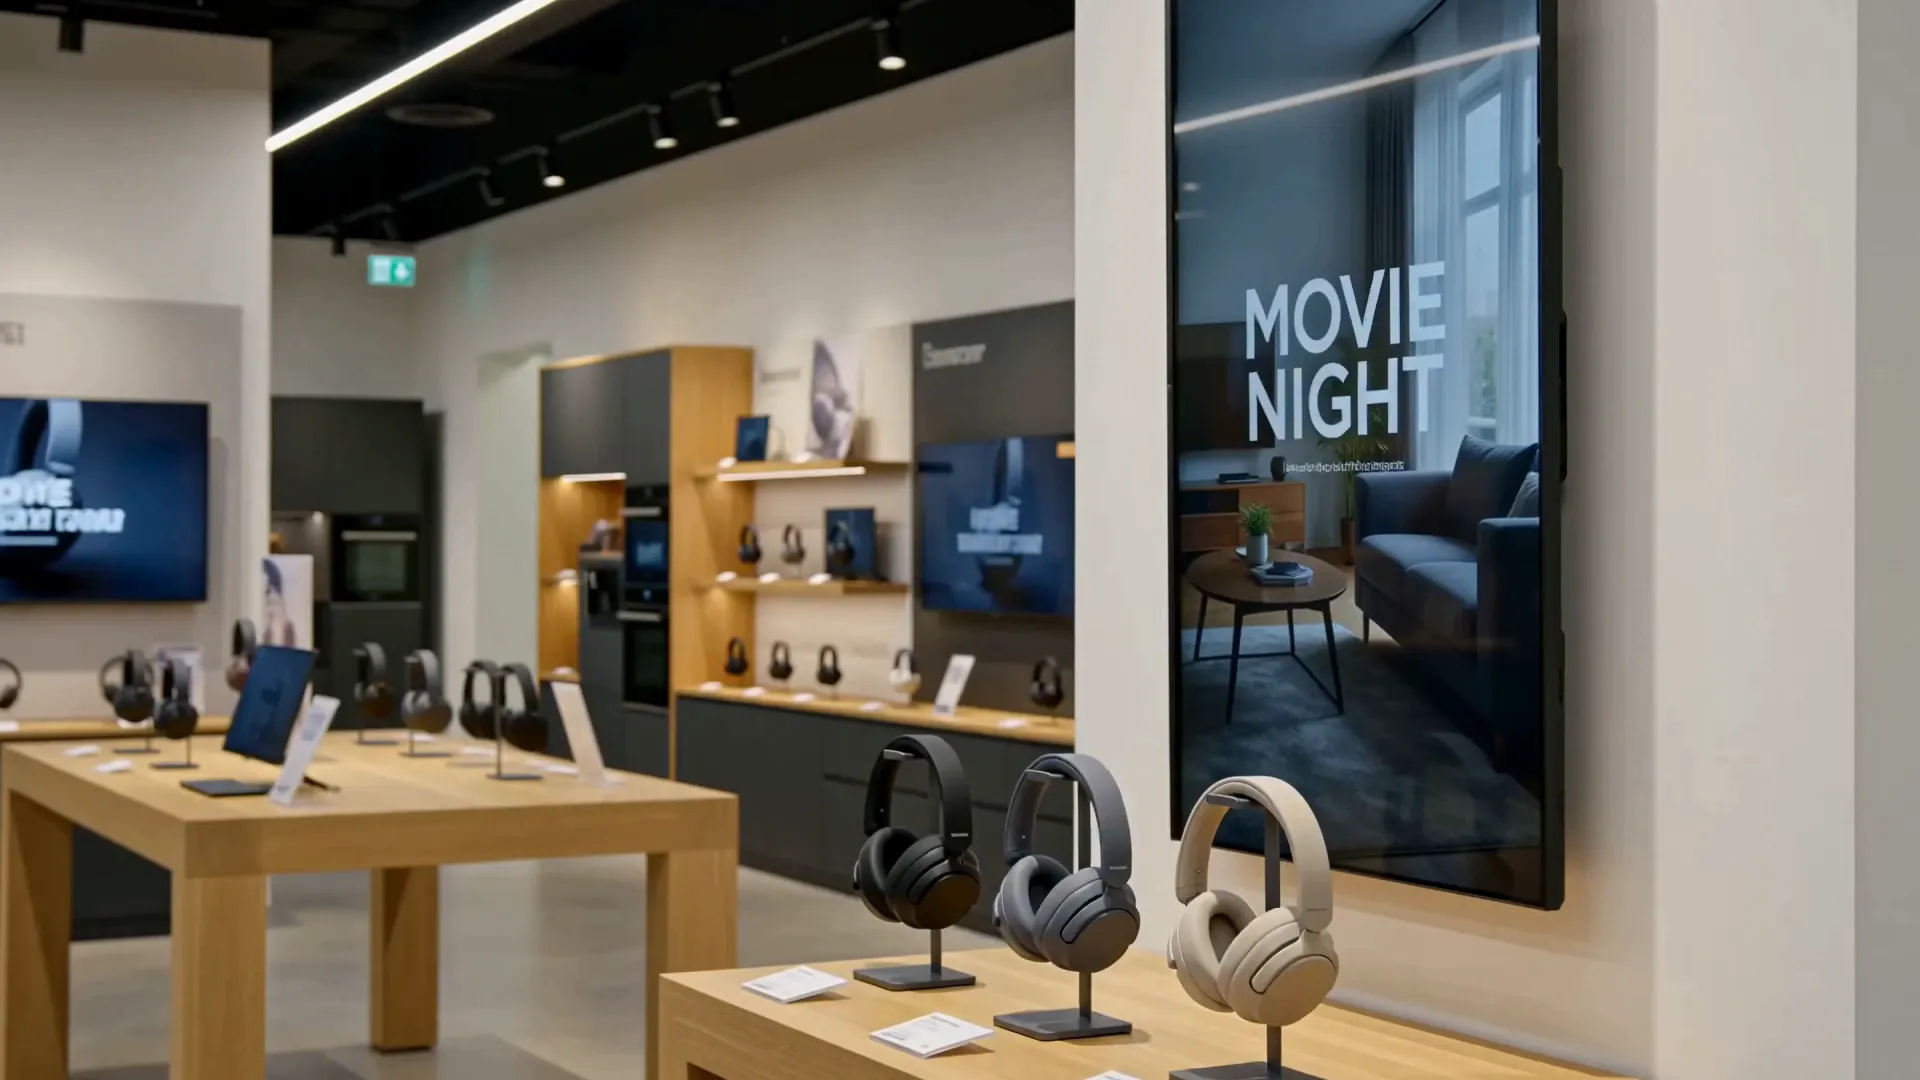
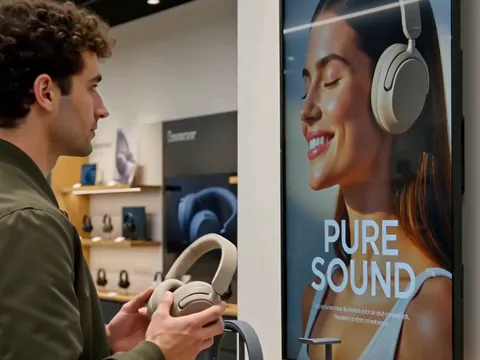 Pilot firstElectronicsWhich products are weighed against each other?Which models are lifted from their stand and which are weighed against each other.
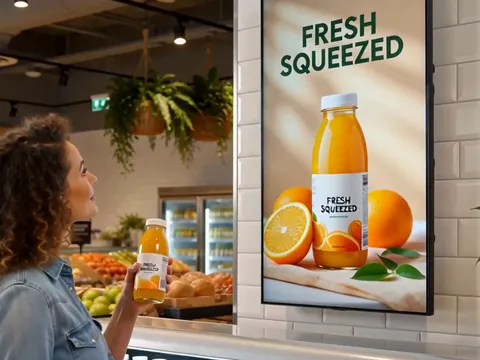 Pilot firstGrocery & FMCGWhich products leave the shelf most often?Which products are taken from the shelf or chiller, and which are picked up and put back.
Screens are optional: the analytics works with cameras alone.
All use casesPickups, holds and put-backs from cameras alone.
Learn morePick up a product; its story appears on the screen beside it.
Learn moreHold a product up to the camera and the screen presents it.
Learn moreWhich content goes with longer holds, per asset and store.
Learn moreOn request: how many came in, anonymously.
Learn moreThe same reports, compared across every branch.
Learn more
GoTrack watches the products. Never the people.
Cameras and hardware specified for each project, placed close to the products: we supply them, or you buy them to the spec.
Not “someone touched the rack” — the exact product and colour variant.
A guided step in the panel — no data-science project, no waiting on a vendor.
Recognition and screens keep running when the internet drops; nothing is lost.
Every store device reports its health and receives updates without a site visit.
Built and supported in İstanbul. Panel and site in Turkish, English and Spanish.
GoTrack is retail vision-analytics software made by GOTONOM in İstanbul. It measures product interaction on the shop floor: which product and colour was picked up, from which shelf zone, how long it was held and whether it went back on the shelf.
Its focus is products: what shoppers do with them. It uses no face recognition, images are processed on a device inside the store, and screens are optional. The full picture: What is GoTrack?
GoTrack is retail vision-analytics software made by GOTONOM in İstanbul. Using cameras placed close to the products, it measures product interaction on the shop floor — which product and colour is picked up, how long it is held and whether it is put back — and shows that product's content on the nearest screen.
In our measurement on 30 September 2026, the screen showed the product within 0.71 s of GoTrack deciding which product was in hand, in all 24 measured fires: a median of 0.35 s with one product on screen and 0.51 s with two. The time from the lift itself to that decision is not yet measured separately.
People counters count who comes in, heatmaps show where people walk, and shelf recognition checks what is on the shelf. GoTrack measures what shoppers do with the products themselves: which product and colour is picked up, how long it is held, and which are put back or compared. Visitor counting can be added on request.
No. There is no face recognition, no face template, no biometric matching, and no shopper is recognised across visits.
No. GoTrack's product analytics works with cameras alone. Screens are optional: add them when you want the shelf to react to the product in hand.
On request, yes. GoTrack's standard reports are about products: what shoppers pick up, hold and put back. For stores that also need visitor numbers, GoTrack can count visitors with the same cameras, anonymously and without face recognition; it is set up per project.
Measure interactions. Understand product performance. Activate better retail experiences.
or write to info@gotonom.com