Lab note: our put-back rate was wrong, and why
Lab note, 8 Oct 2026: our dashboard showed 69% put back on a test shoe table where every shoe came back. Four counting errors, fixed and re-measured.
The share of pickups that go back to the shelf is one of the few signals about the shoppers who did not take the product. How it is calculated, how to read it, and the mistakes to avoid.
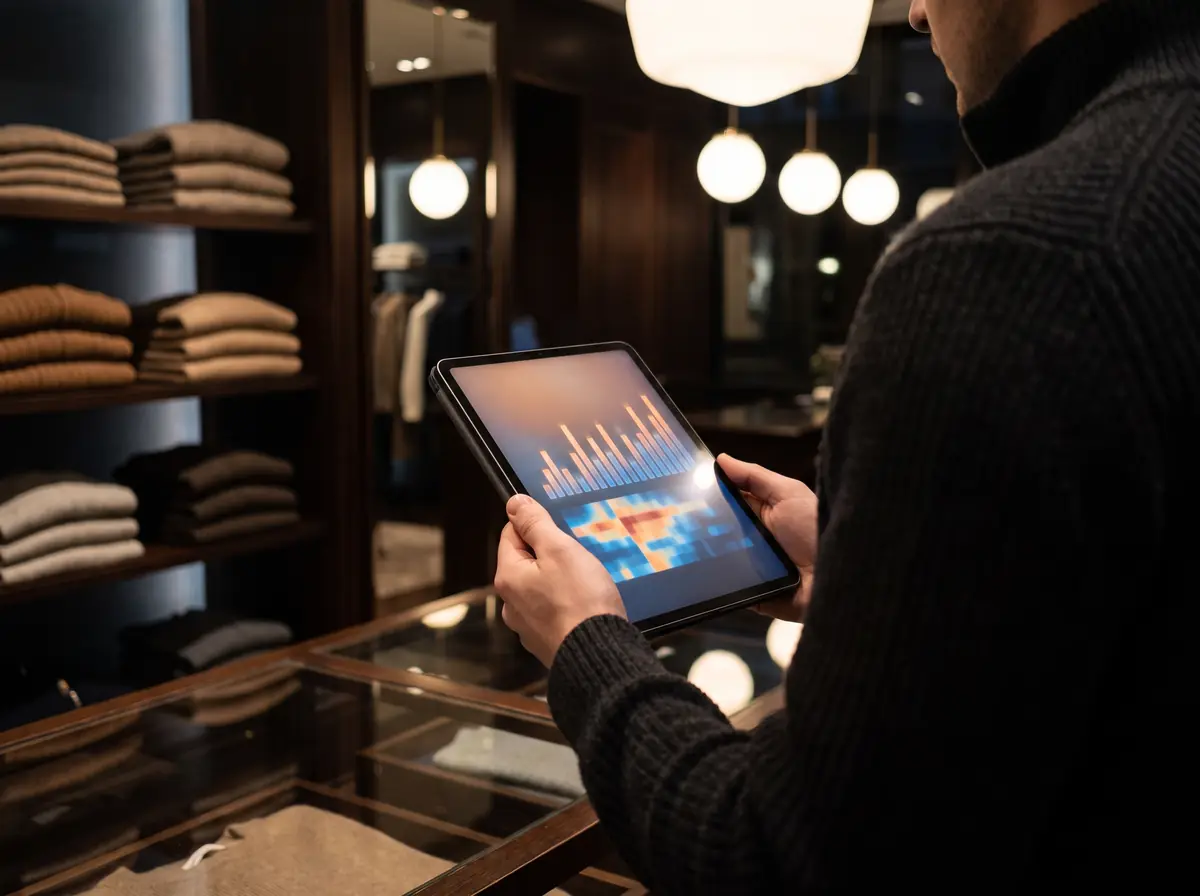
Put-back rate is the share of pickups that end with the product going back to the shelf: put-backs divided by pickups, for a product, colour, zone or store over a period. A product picked up 200 times and put back 150 times has a put-back rate of 75%.
Sales data counts the products that left the store. The put-back rate counts the ones that were considered and returned: interest that did not turn into a decision at the shelf. It shows where to look; it does not say why.
Read it with the other signals: how often a product is picked up, how long it is held and what it is compared with.
| Pattern | What it can suggest | What to check |
|---|---|---|
| Many pickups, high put-back rate | Interest, but something stops the decision once the product is in hand | The price label, sizes on the shelf, the product seen up close, its content on a nearby screen |
| Many pickups, low put-back rate | The product usually leaves the shelf with the shopper | Stock and replenishment |
| Few pickups | Low visibility or low appeal: a never-touched candidate | Placement, facing and lighting; test a move |
| Long hold, then put back | The shopper weighed it seriously | What it was compared with, and which product was kept |
GoTrack uses its cameras to record each pickup and whether the product goes back to the shelf, per product, colour, zone and store. Nothing is fitted to the products. The put-back rate sits in the reports and exports next to pickups, hold time, products compared together and never-touched products.
To size what put-backs could be worth in your stores, try the put-back calculator. Terms are defined in the glossary.
There is no universal benchmark: it depends on the category, the price and the store. The useful comparisons are a product against itself over time, and against similar products in the same store and zone. GoTrack reports the rate per product, colour, zone and store so those comparisons are possible.
Yes. It reports pickups per product and variant, average hold time, put-back rate, products compared together and never-touched products. It measures how long a product is held, not how long someone stands in front of it.
Not on its own. GoTrack measures what happens at the shelf — pickups, hold time and put-backs — and does not read POS data. To relate interest to sales, join GoTrack's CSV exports or webhook events with your own sales data.
Yes, as a before-and-after comparison: move a product to a new shelf zone or fixture and compare its pickups, hold time and put-backs with the period before. GoTrack shows the change; it does not run statistical tests for you.
We will show you the reports on your own kind of products.
or write to info@gotonom.com